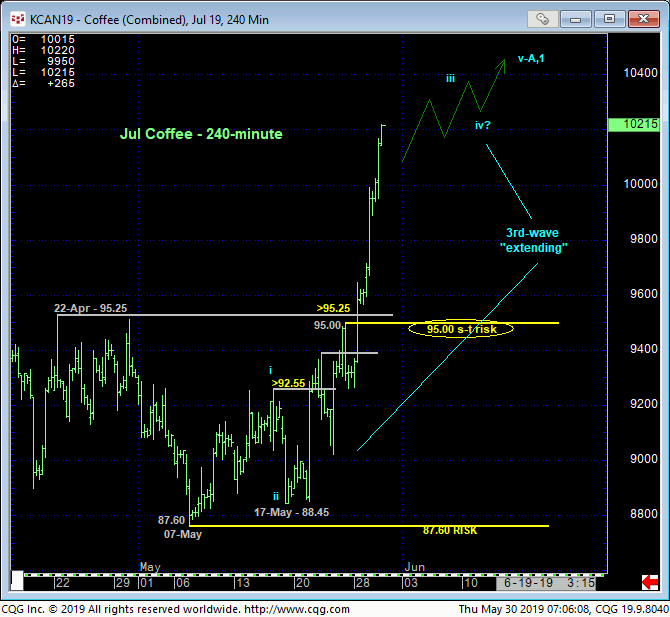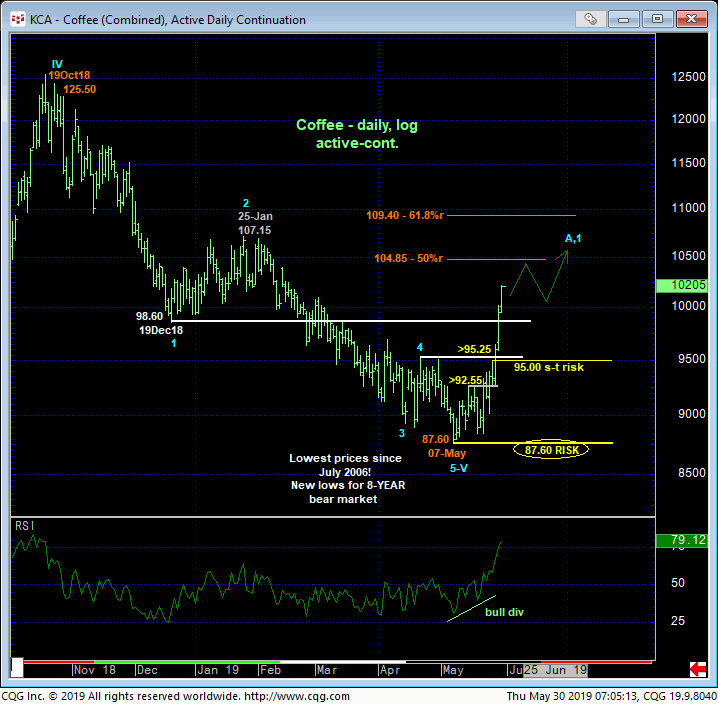
The market began flirting with a base/reversal threat following 21-May’s poke above 16-May’s 92.55 initial counter-trend high discussed in 23-May’s Technical Blog. Relative to the magnitude of the secular bear market however, this minor display of strength was of an insufficient scale to suggest anything more than another corrective hiccup. But the extent and impulsiveness of this week’s accelerating rally above 22-Apr’s 95.25 corrective high and our key risk parameter is a game-changer that allows us to conclude 07-May’s 87.60 low as the end of AT LEAST the downtrend from last Oct’s 125.50 high and possibly the end of a 5-wave Elliott sequence that dates from Nov’16’s 176.00 high.
Moreover, the rally from 17-May’s 88.45 low detailed in the 240-min chart below looks to be a 3rd-wave that’s “extending”, meaning discernible sub-divisions on this same scale. This suggests that this rally has a number of iterative (4th-wave) corrective setbacks and subsequent (5th-wave) resumptions of the rally before it peaks out. As a result of this extended rally we are identifying 24-May’s 95.00 high as a minor 1st-Wave high of a smaller scale and our new short-term risk parameter that the market would not be able to fail below to maintain the impulsive integrity of this count.


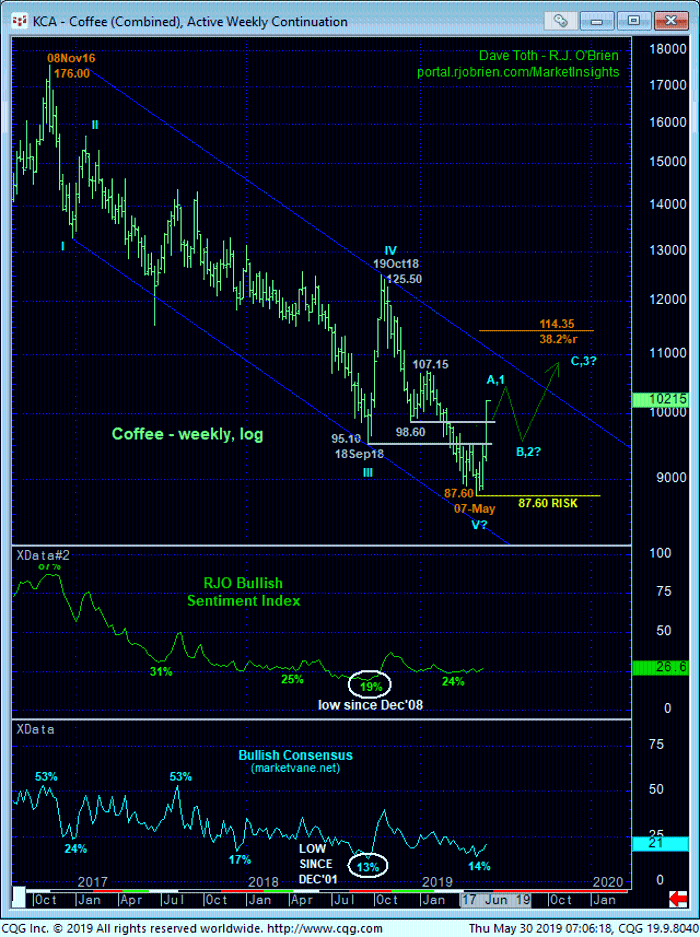
ON a broader scale shown in the daily log chart above and weekly log chart below, the market has confirmed all the compelling and opportunistic factors of a base/reversal environment that could be major in scope, including:
- a confirmed bullish divergence in momentum amidst
- historically bearish levels of market sentiment/contrary opinion
- its gross failure to sustain Mar-May’s break below a ton of former support-turned-resistance between 95.10 and 98.60 that
- arguably completes 5-wave sequences down from last Oct’s 125.50 high AND Nov’16’s 176.00 high.
If correct, the market could be on the cusp of a major base/correction/reversal higher that could span quarters and produce gains to at least the 114-to-125-range and possibly much higher. A failure below 07-May’s 87.60 obviously key low and new long-term risk parameter is required to negate this call.

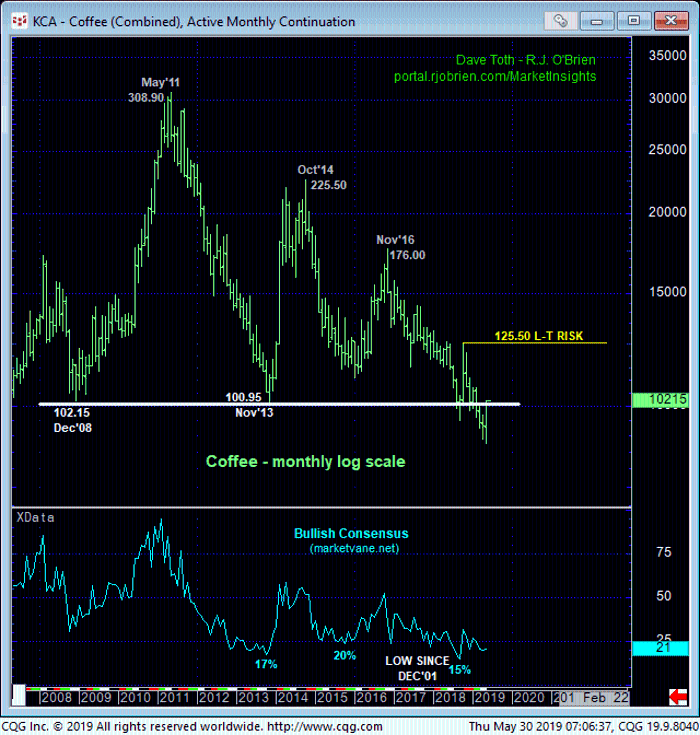
Finally, on an even broader monthly basis, the chart below shows multiple years of support from the 101-to-102-area. If there’s still a requisite threshold left for this reversal threat to hurdle, it would be the general 102-handle-area Much beyond this area and the major base/reversal threat will be a considerable one warning of potentially protracted gains that could easily span quarters.
These issues considered, a new bullish policy remains advised with a failure below at least 95.00 required to threaten this call. We anticipate further gains for the foreseeable future but beware an eventual peak to this initial (A- or 1st-Wave) rally that could usher in a (B- or 2nd-Wave) corrective rebuttal that could be extensive, offering an interim trading opportunity from the bear side and, most importantly, an eventual preferred risk/reward from the bull side that could be extraordinary for the long-term.


