With the exception of (perhaps surprisingly) the metals sector and cocoa which have remained mired in massive lateral ranges that have included tremendous whipsaw risk, virtually all other commodity markets and sectors have enjoyed some of the most massive rallies in their respective histories over the past couple years. Equities, the entire ag complex, livestock, energies, the USD and most of the softs (coffee, sugar and cotton) have mainly been in one-way moves higher with few interruptive corrective hiccups.
For the most part and if there is such a thing in commodities trading, these major uptrends have provided traders a relatively easy-money ride. “The trend is your friend” hasn’t remained an industry mantra for decades for no reason. Indeed and technically, trends are the most advantageous environments in which to participate more aggressively as the odds of directional bets performing favorably are higher.
By sharp contrast, when a market stops trending, it exposes one of either two states: an interruptive correction within the trend OR a reversal process. Both of these states are characterized by generally lateral, choppy, challenging price action where the odds of aimless whipsaw risk are higher. Such non-trending environments lower the odds of directional bets paying off, warranting a more conservative approach to risk assumption. It is our opinion that even the most successful traders in the world are right on only about a third of their directional bets. We believe this is true as a result of decades of empirically studying markets and the observation that all markets on all scales only “trend” about a third of the time. The other two-thirds of the time are spent either in consolidation mode 9within the broader trend) or in reversal mode. And again, both corrective/consolidative and reversal environments are choppy, aimless beasts where the odds of trading profitably are even tougher than under trending conditions.
Another technical observation (and we believe tenet) to navigating the common correction-vs-reversal debate and challenge is that the forces that have driven these massive bull markets for quarters are unlikely to evaporate quickly. Rather and typically for major peak/reversal processes, after an initial counter-trend decline that confirms the requisite bearish divergence in momentum needed to break the major bull trend, subsequent and often times extensive corrective rebuttals to that initial decline are components of the reversal process. This is the basis for our 3 Key Reversal Requirements to improve the successful and favorable risk/reward navigation of the correction-vs-reversal debate and challenge:
- a confirmed bearish divergence in momentum on a scale sufficient to threaten the secular bull trend
- proof of trendy, impulsive 5-wave behavior on that initial counter-trend decline, and, most importantly,
- proof of labored, corrective 3-wave behavior on a subsequent recovery attempt.
We preface today’s Technical Blog with these thoughts as we believe recent waning-upside-momentum price action across virtually every one of these major bull markets are the early warning signs that the best and easiest stages of these major trends are behind us. Especially with the understandable backdrops of historically frothy sentiment/contrary opinion levels, this waning upside momentum jeopardizes the risk/reward merits of longer-term bullish policies as well as challenging, choppy, aimless and more volatile price action in the weeks and months ahead that we believe warrants a more conservative approach to directional risk assumption.
Below, we apply the observations and tenets discussed above to a small swathe of markets as examples of the technical conditions that we believe exist across virtually all of the major bull markets over the past couple years in attempt to more successfully and conservatively navigate these correction-vs-reversal environments.
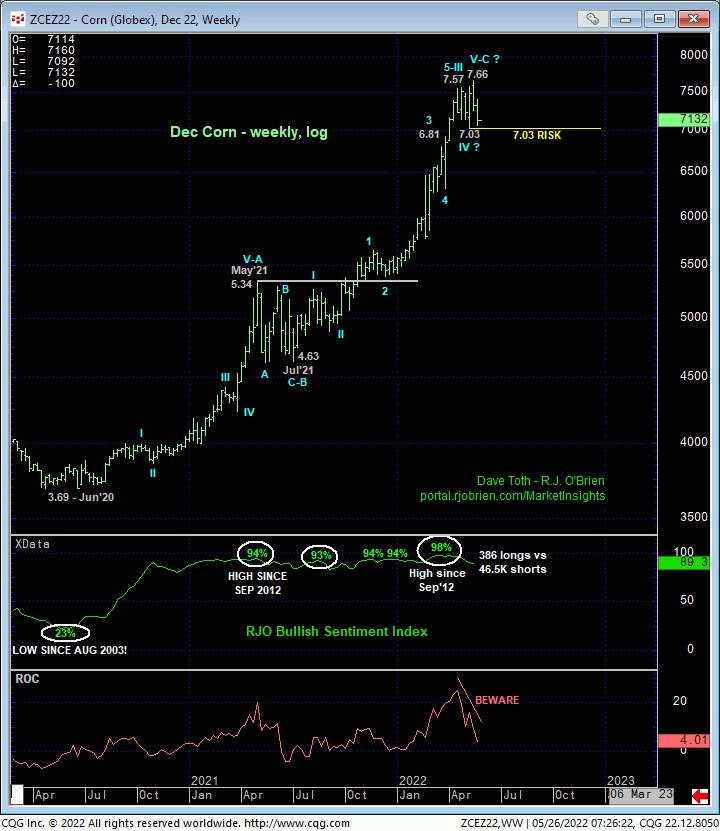
DEC CORN
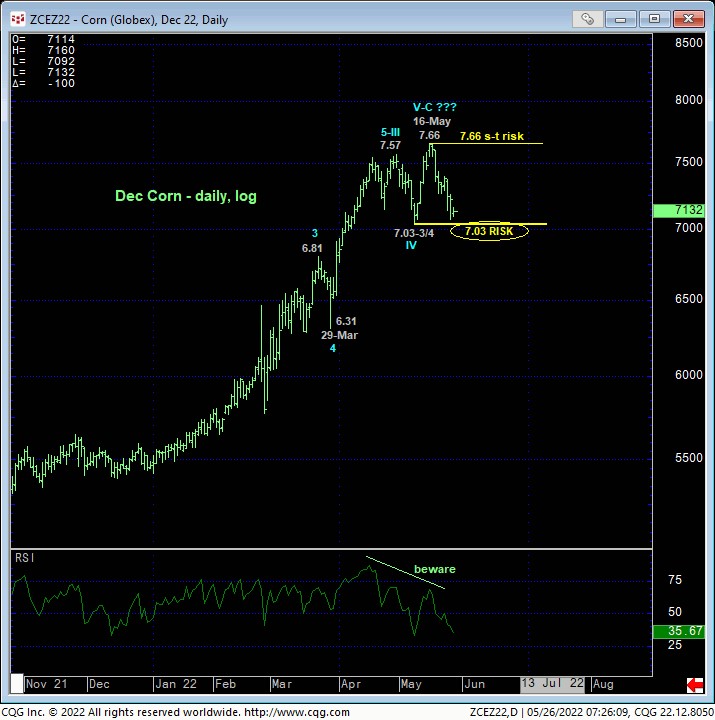
It’s easy to see the waning upside momentum in Dec corn over the past month or so on both a daily (above) and weekly (below) log scale basis. A failure below 09-May’s 7.03 corrective low will CONFIRM this divergence to the point of non-bullish action like long-covers, cautious bearish punts and initial bear hedges. The other crucial by-product of a sub-7.03 momentum failure would be the market’s definition of 16-May’s 7.66 high as the specific and objective bear risk parameter from which any/all non-bullish decisions can then be objectively based and managed. This specific identification of risk and every trading decisions, that can only be defined technically, is arguably the single greatest advantage of technical analysis as a key component to one’s decisions-making equation. Without this component, price levels from which to initiate or risk directional bets are subjective, emotional or plucked out of non-optimal thin air.
Should the market break below 7.03, can we CONCLUDE the end to the secular bull trend? Of course not as, at best, this would satisfy only the first of our three reversal requirements. Such sub-7.03 weakness WOULD be sufficient to pare or neutralize bullish exposure as 1) this would stop the bleeding of either a bigger bull market correction OR the initial counter-trend decline of a major reversal while 2) the market would have confirmed a rejected/defined high as the new bear risk parameter from which any non-bullish decisions can then be objectively based and managed. Considerably more price action would then be required to reinforce a broader peak/reversal threat, like proof of trendy 5-wave behavior on that initial decline and, most importantly, proof of 3-wave corrective behavior on the likely corrective rebuttal that, again, could be extensive in terms of both price and time.
Specific to the ag complex and with the late-Jun Grain Stocks and Acreage report on which major turns often occur still a month away, even if Dec corn fails below 7.03 soon, we doubt very highly that a more aggressive bearish policy on a sub-7.03 failure will come without pain and frustration. The one key factor that any non-bullish decisions would have following a break below 7.03 is specific and objective risk on those bets to 16-May’s 7.66 high. So if you’re anxious to chase bearish exposure lower on a failure below 7.03, your risk is to 7.66.
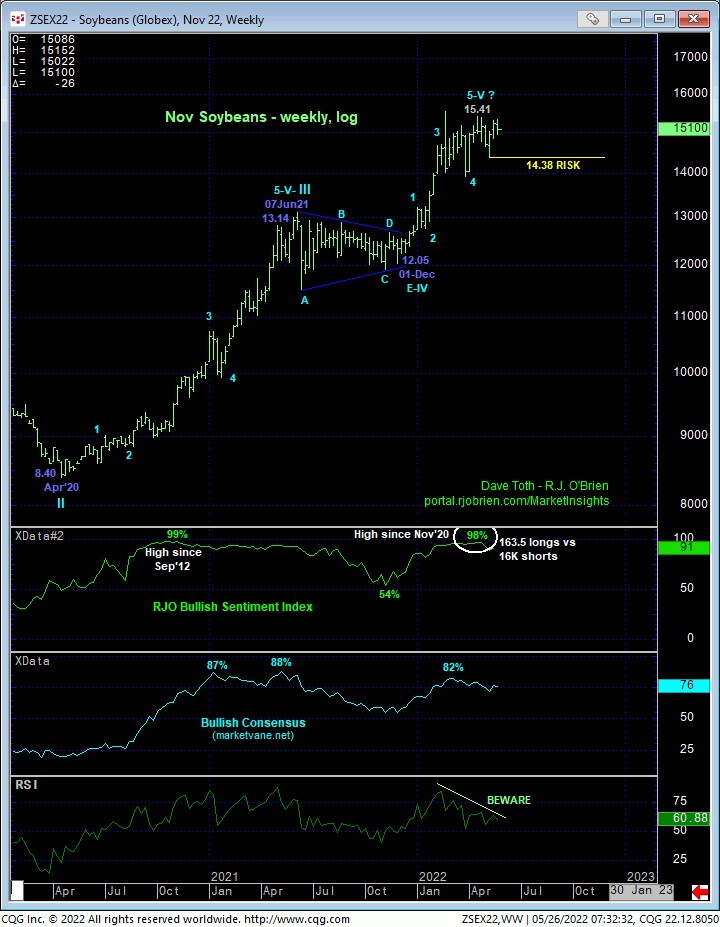
NOV SOYBEANS
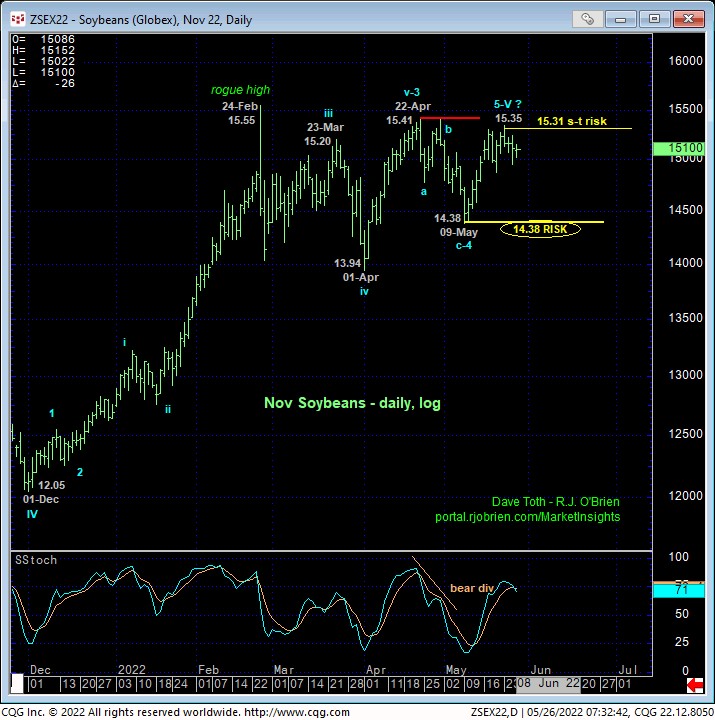
Here too, it’s easy to see waning upside momentum over the past THREE MONTHS that have included challenging, choppy, lateral-to-higher prices in which the secular bull trend remains arguably intact despite recent short-term weakness at the upper recesses of the past month’s range. MINIMALLY, a failure below 09-May’s 14.38 corrective low remains required to even threaten the secular bull trend. And even then, such a sub-14.38 decline would only satisfy the first of our three reversal requirements. However, these charts clearly show the slowdown in the rate of ascent that’s a typical precursor to a peak/reversal process. But as the market has yet to confirm weakness of a scale sufficient to threaten the major bull, it remains premature to consider a flip to a longer-term bearish policy. This said, we believe the next two months may be transformative.
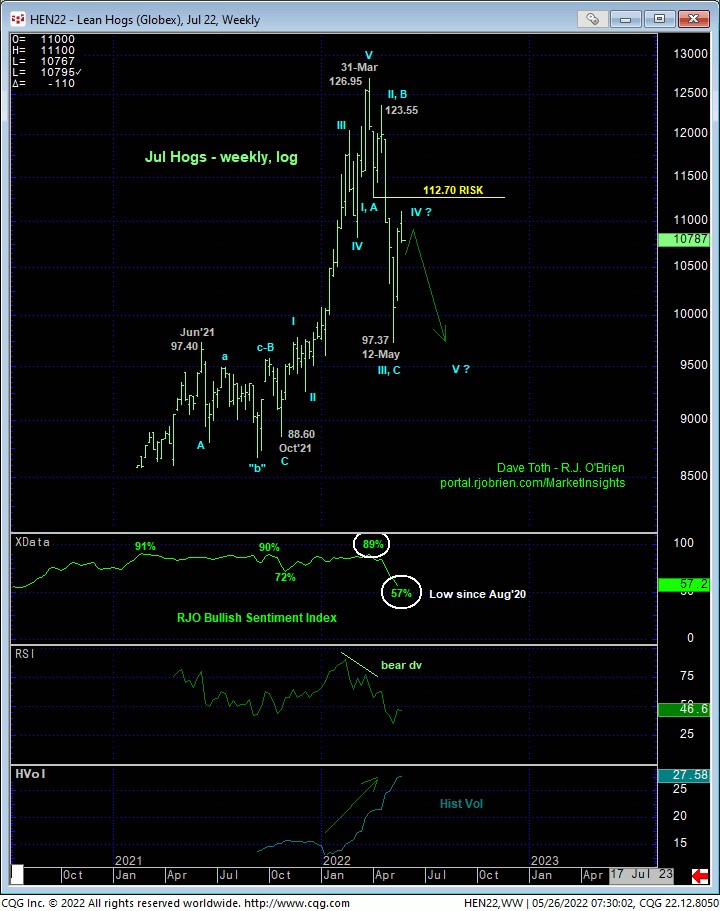
JUL HOGS
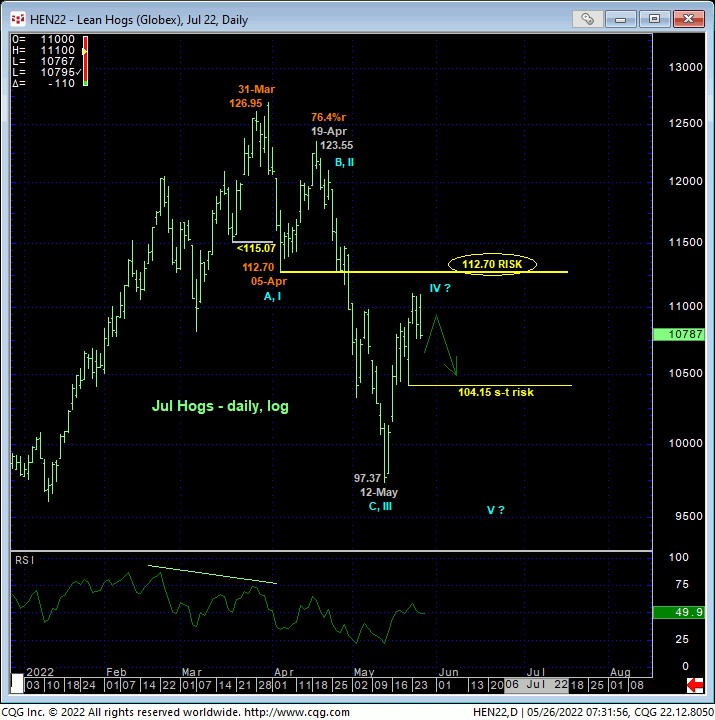
The past couple months’ price action in Jul hogs provides an outstanding template for the observations and tenets described at the outset of this blog. This market first threatened the major bull trend on 05-Ar’s bearish divergence in momentum below 18-Mar’s 115.07 corrective low, exposing the initial (A- or 1st-Wave) counter-trend decline. As the forces behind the massive secular bull trend weren’t likely to simply vanish into thin air, this peak/reversal PROCESS include the typical and, in this case, “extensive” (B- or 2nd-Wave) corrective rebuttal that retraced 76.4% of the initial counter-trend decline from 126.95 to 112.70.
This is an excellent example of why we do not endorse “chasing” initial counter-trend momentum failure for anything other than neutralizing previous bullish exposure; because the risk/reward merits of doing so are poor. For those anxious to chase new bearish exposure on such an initial counter-trend decline, enduring a potentially extensive corrective rebuttal must be acknowledged and assumed. And good luck with that. This is precisely why the Sharpe ratios of many black-box algo trading systems are well below 1.0.
Also, please note in the weekly log chart below the sharp increase in historical volatility that’s not unusual in peak/reversal processes. Again, under these circumstances, a more conservative approach to risk assumption is urged.
JUN E-MINI S&P
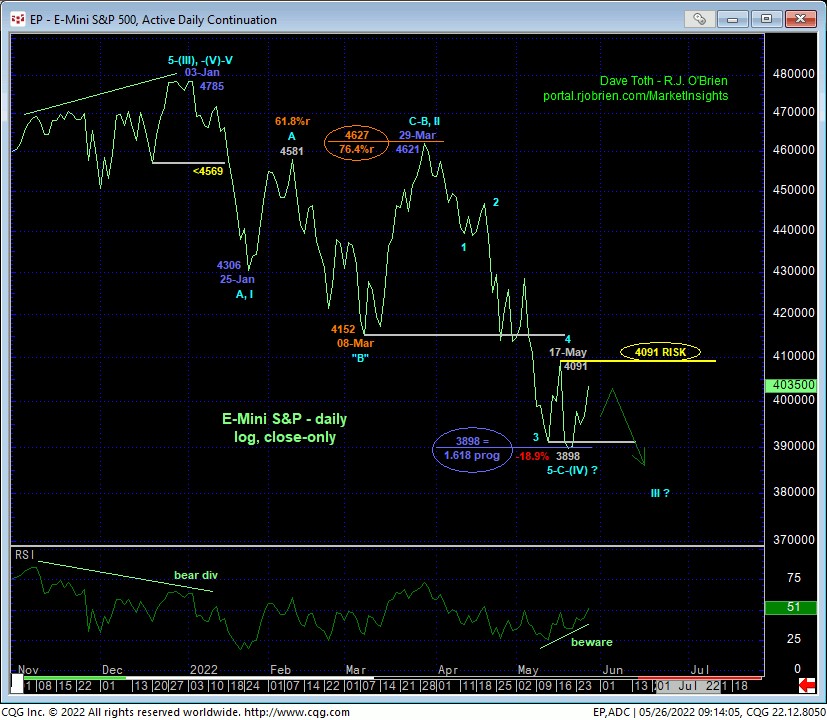
And finally, by now everyone has come to grips with the major peak/reversal in the equity indexes globally. The E-mini S&P 500 market shown in the daily log close-only chart below is yet another textbook example of the exact same technical discipline and principles discussed above and every day in every market we cover in Market Insights. Prior to Jan’s now-obvious top, the secular bull trend consolidated laterally and challengingly during Nov and most of Dec’21 before its final 5th-Wave poke to a new all-time high close on 03Jan22 at 4785. This Nov-Dec “slowdown” in the rate of ascent set the stage for a bearish divergence in momentum that was confirmed by 19-Jan’s failure below 20-Dec’s 4569 corrective low that threatened the secular bull trend enough to warrant neutralizing bullish exposure, especially given historic bullish sentiment/contrary opinion levels.
After Jan’s initial counter-trend break, the market endured TWO extensive corrective rebuttals of 61.8% and subsequently 76.4% before Apr-May’s plunge/reversal really took hold. The desire to get an early leg up on a “major top and reversal” is understandable. But typically, following that initial counter-trend swoon, markets provide an often times extensive corrective retest of the high before continuing the peak/reversal process. Waiting for and requiring this third of our three reversal requirements pays off with a much preferred and more favorable risk/reward opportunity on the bear side.
Understanding the technical precepts typical of peak/reversal environments is helpful in navigating correction-vs-reversal environments on a scale and discipline commensurate with one’s personal risk profile. Please keep these technical tools and considerations in mid when navigating any/all of the prospective tops we believe might unfold in the weeks and months ahead across the ag, energy, USD and softs sectors. Given waning upside momentum and historically bullish sentiment/contrary opinion levels across virtually all of these markets, we believe 3Q22 may provide extraordinary risk/reward opportunities from the bear side. However, patience remains required in most cases. Additionally and for at least the next few months, traders should expect and prepare for increasingly challenging, aimless price action that we believe warrants a more conservative approach to directional risk assumption. These are NOT the environments to aggressively bet the farm.