SEP COFFEE
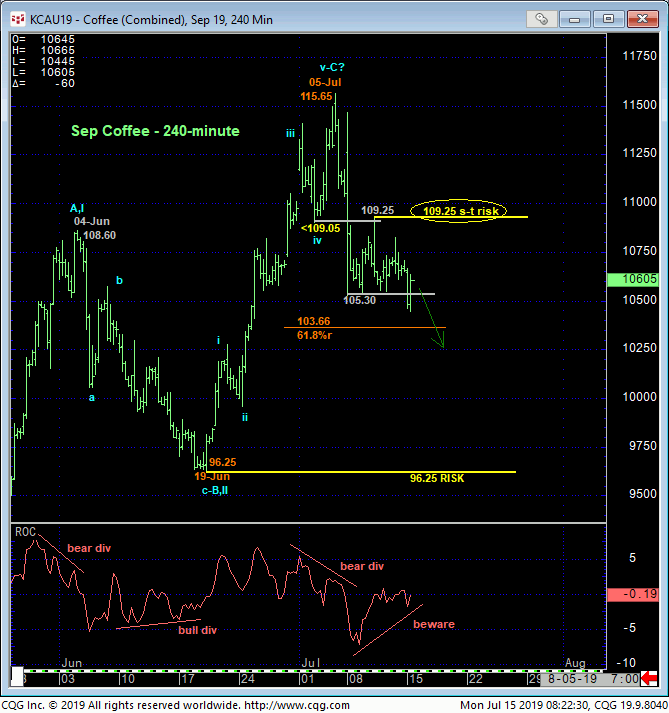
Today’s resumed weakness below the past week’s 105.30-area support reaffirms the intermediate-term downtrend and leaves last Wed’s 109.25 high in its wake as the latest smaller-degree corrective high this market is now required to sustain losses below to maintain a more immediate bearish count. It’s failure to do so will confirm a bullish divergence in momentum that would not only stem this month’s slide, but possibly resurrect a broader base/reversal environment that might then expose a run to new highs above 05-Jul’s 115.55 high. Per such this 109.25 level is considered our new short-term risk parameter from which traders can rebase and manage recent non-bullish decisions like long-covers and cautious bearish punts.
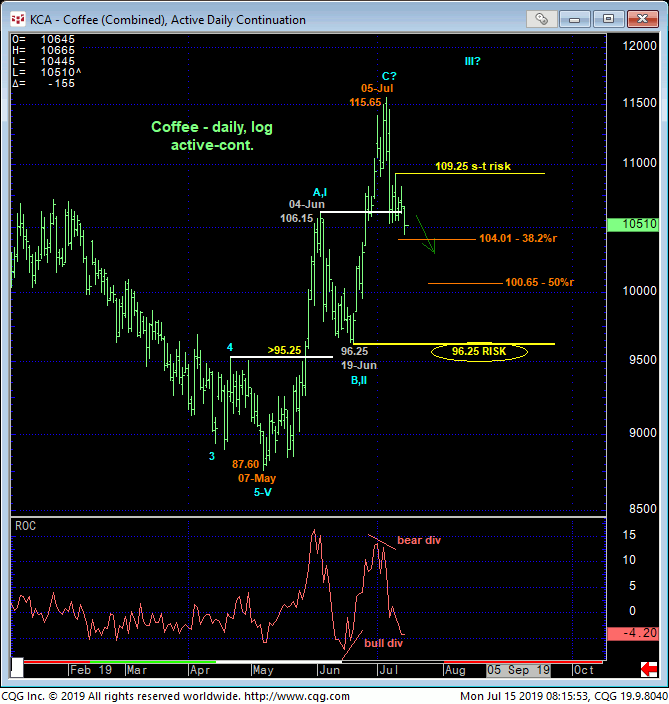
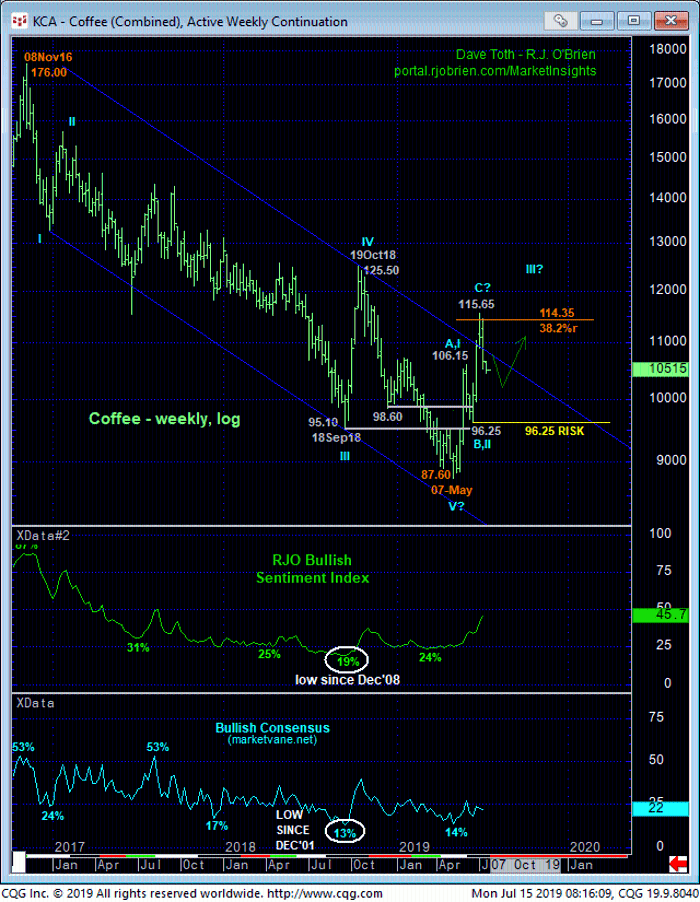
On a broader scale, traders are advised to be flexible to a major move in EITHER DIRECTION. Since 28-May and as discussed in that day’s Technical Blog, we’ve described a base/reversal-threat environment that could be major in scope stemming from bullish divergence in both daily and weekly momentum, historically bearish sentiment conditions not seen in at least 11 years and arguably complete major 5-wave Elliott sequences down. Such a base/reversal prospect remains intact until and unless this market fails below at least 19-Jun’s 96.25 larger-degree corrective low and key risk parameter and especially 07-May’s obviously key 87.60 low.
This said however, we cannot ignore the prospect that May-Jul’s recovery from 87.60 to 115.65 is only a 3-wave and thus corrective structure as labeled in the daily log chart above. Left unaltered by a recovery above 05-Jul’s 115.65 high, this 3-wave recovery is arguably a corrective event that would warn of a resumption of the secular bear market to eventual new lows below 87.60. If this alternate bearish count is to prevail, we would expect proof of trendy, impulsive behavior to the downside following breaks below levels like 105.30. Herein lies the importance of even short-term risk parameters like 109.25, the recovery above which would tilt the longer-term directional scales back to the bull side.
These issues considered, a cautious bearish policy remains advised for shorter-term traders with a recovery above 109.25 negating this call, warranting its cover and possibly resurrecting the broader base/reversal count to new highs above 115.65. A cautious bullish policy remains OK for long-term players with a failure below 96.25 required to threaten this count enough to warrant its cover. In effect we believe the market has identified 96.25 and 109.25 as the key directional triggers heading forward.
OCT SUGAR
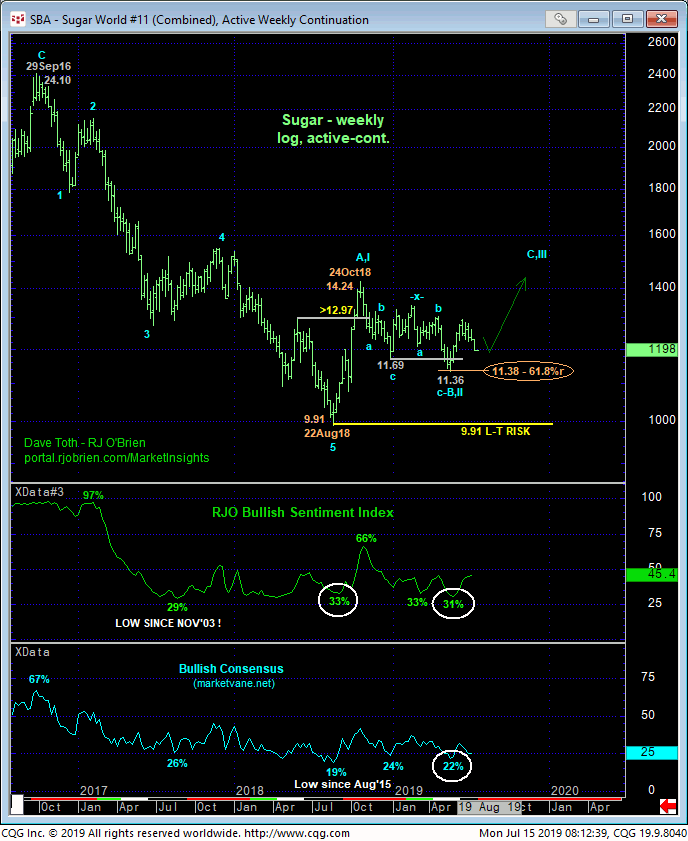
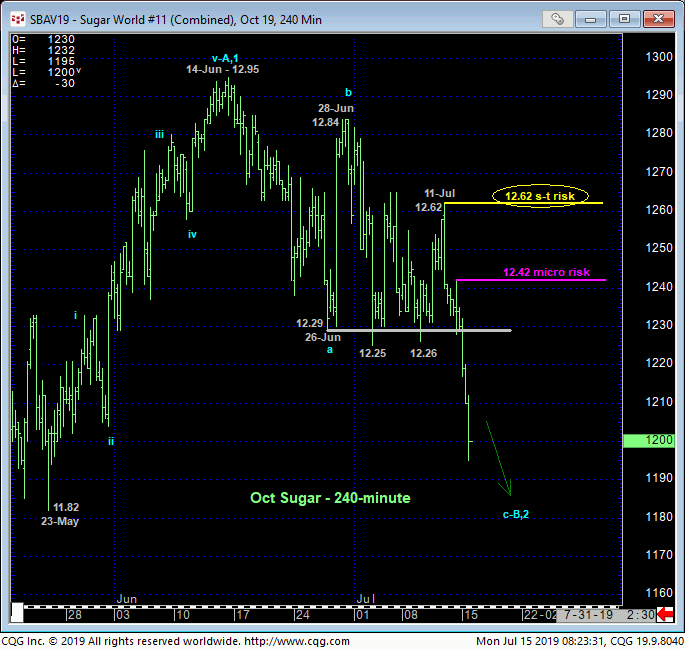
Today’s blast through the past 2-1/2-weeks’ 12.25-to-12.30-range support presents a similar technical construct and expectations to those detailed above in coffee and reaffirms the intermediate-term downtrend that leaves Fri and Thur’s corrective highs in its wake at 12.42 and 12.62 that now serve as our new micro- and short-term risk parameters to an interim bearish policy for shorter-term traders. Former 12.25-to-12.30-area support is expected o provide new near-term resistance ahead of further lateral-to-lower prices.
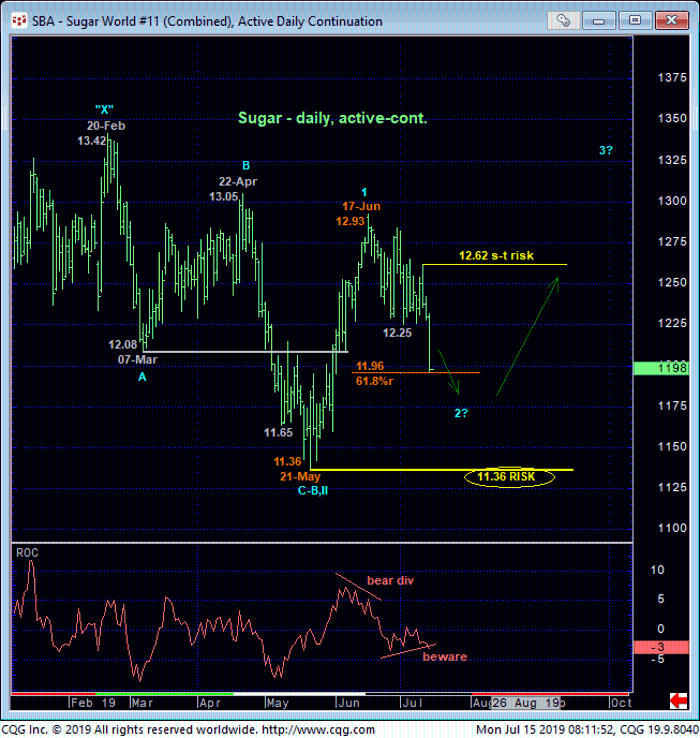
These risk parameters may come in handy as the daily chart above shows the market engaging the (11.96) 61.8% retrace of May-Jun’s 11.36 – 12.93 rally within the context of a broader base/reversal-threat environment that dates from Aug’18’s 9.91 low shown in the weekly log active-continuation chart below. A failure below 21-May’s 11.36 larger-degree corrective low and key risk parameter remains minimally required to threaten this base/reversal count that warns of a resumption of Aug-Oct’18’s initial counter-trend rally to eventual new highs above 14.24. This long-term base/reversal count still stems from the unique combination of:
- a confirmed bullish divergence in WEEKLY momentum amidst
- historically bearish sentiment levels
- proof of trendy, impulsive price action on last year’s initial (A- or 1st-Wave) rally and
- proof of labored, corrective 3-wave behavior on the subsequent relapse attempt from Oct’18’s 14.24 high to 21May19’s 11.36 low.
Until and unless threatened by a failure below 11,36, the past month’s relapse could be offering long-term players an outstanding risk/reward buying opportunity. WE just need a confirmed bullish divergence in momentum to stem the clear and present intermediate-term downtrend and reject/define a more reliable low from which those longs can be objectively based and managed.
These issues considered, a cautious bearish policy remains advised for shorter-term traders with a recovery above at least 12.42 and preferably 12.62 required to threaten or negate this call and warrant its cover. A cautious bullish policy remains advised for long-term players with a failure below 11.36 required to warrant its cover.
