JUL RBOB
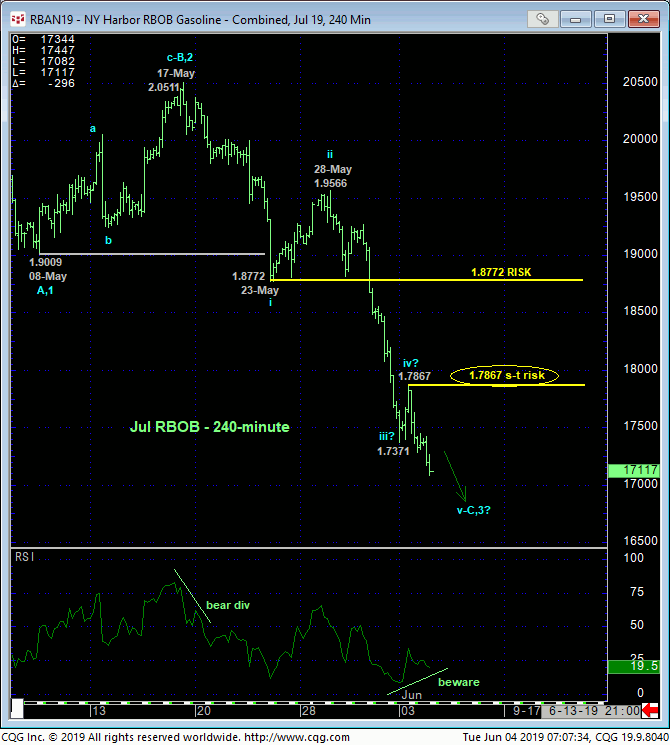
Yesterday and overnight’s break below Sunday night’s 1.7371 low reaffirms the developing downtrend and leaves yesterday’s 1.7867 high in its wake as the latest smaller-degree corrective high this market is now minimally required to recoup to confirm a bullish divergence in short-term momentum, stem the slide and expose even an interim corrective rebound, let alone threaten the major downtrend. In this regard this 1.7867 level is considered our new short-term risk parameter from which shorter-term traders can rebase and manage the risk of a still-advised bearish policy and exposure
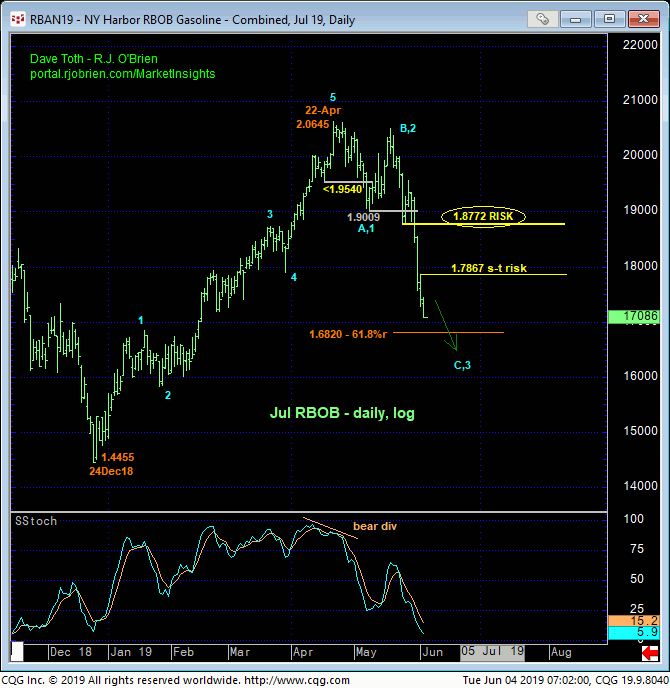
The extent and impulsiveness of the developing downtrend is clear in the daily log chart above with strength above 23-May’s 1.8772 (suspected 1st-Wave) low required to jeopardize the impulsive integrity of a larger-degree 5-wave Elliott sequence down from 28-May’s 1.9566 high. This 1.8772 level is our long-term risk parameter from which longer-term players can effectively manage the risk of a bearish policy.
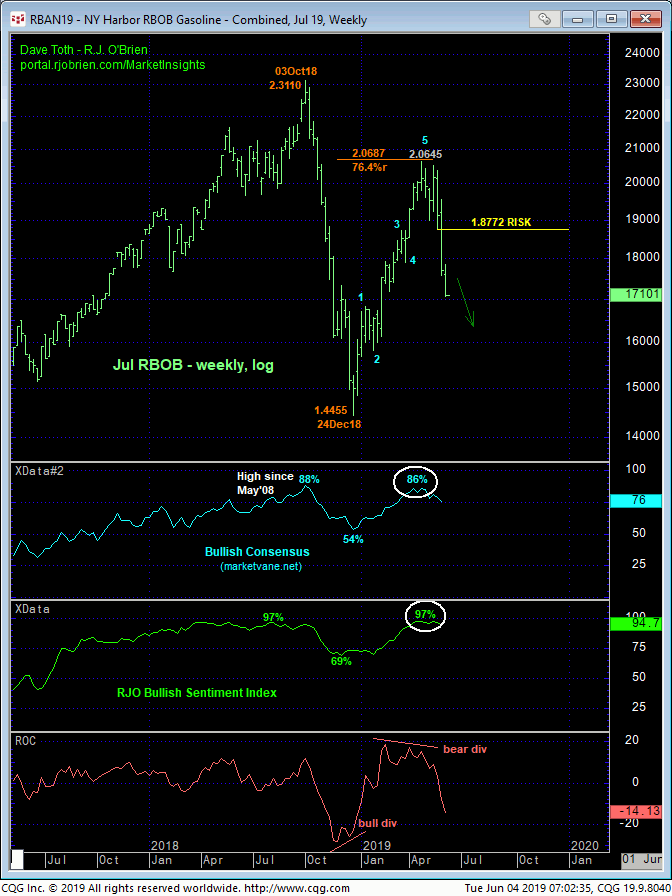
Contributing still to a broader bearish count DESPITE the extent to which this market has fallen the past month-and-a-half are the stubbornly bullish sentiment/contrary opinion indicators shown in the weekly log chart below. At still-frothy levels this long-&-wrong exposure remains as a source of fuel for continued and perhaps severe downside vulnerability straight away.
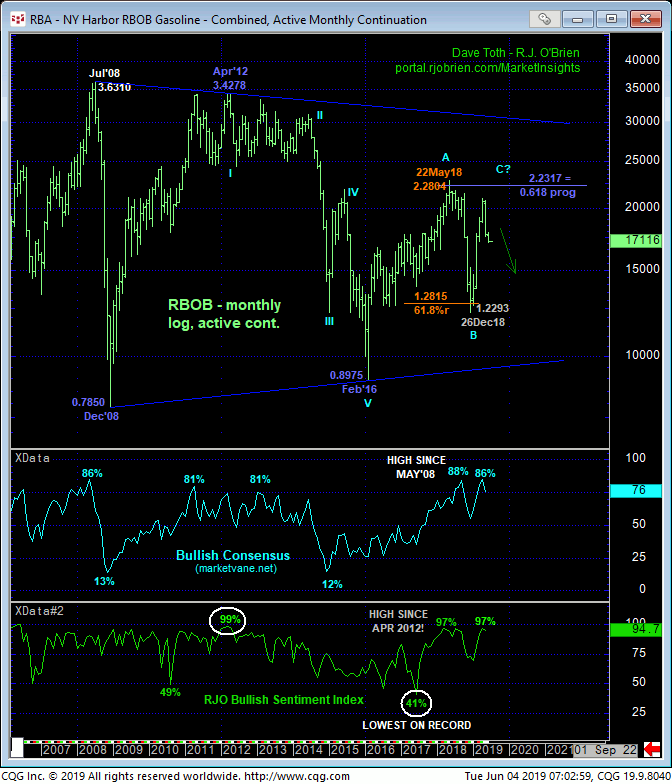
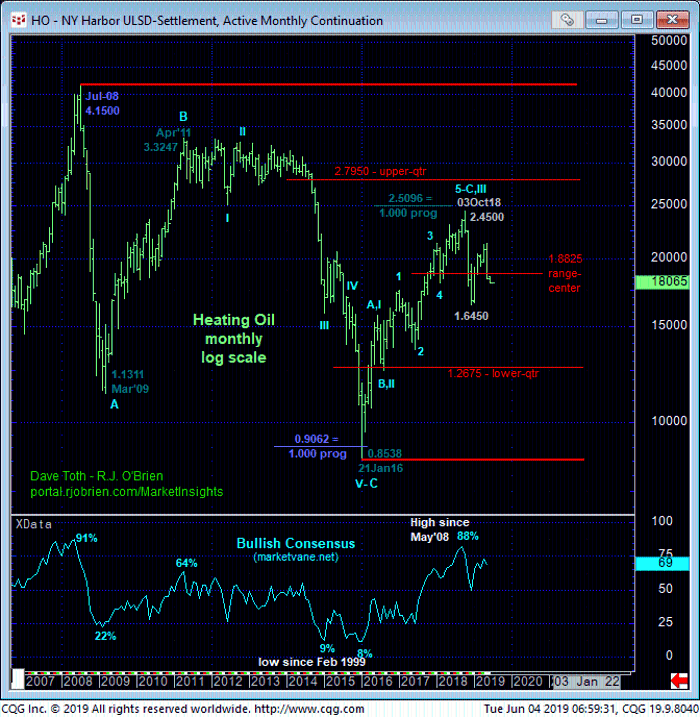
Finally and from a historic perspective, the monthly log active-continuation chart below shows the market pretty much smack in the middle of an arguable 11-YEAR lateral triangle formation where the odds of aimless whipsaw risk remain high on this scale. Wild, volatile fluctuations between 2.25-and-1.25 should not surprise in the quarters and perhaps years ahead. For the time being however and within the context of this mega-lateral-range, the trend remains down on any practical scale and is expected to continue and perhaps accelerate. A full and aggressive bearish policy remains advised with strength above at least 1.7867 and preferably 1.8772 required to threaten and then negate this count, warranting defensive steps commensurate with one’s personal risk profile.
JUL HEATING OIL
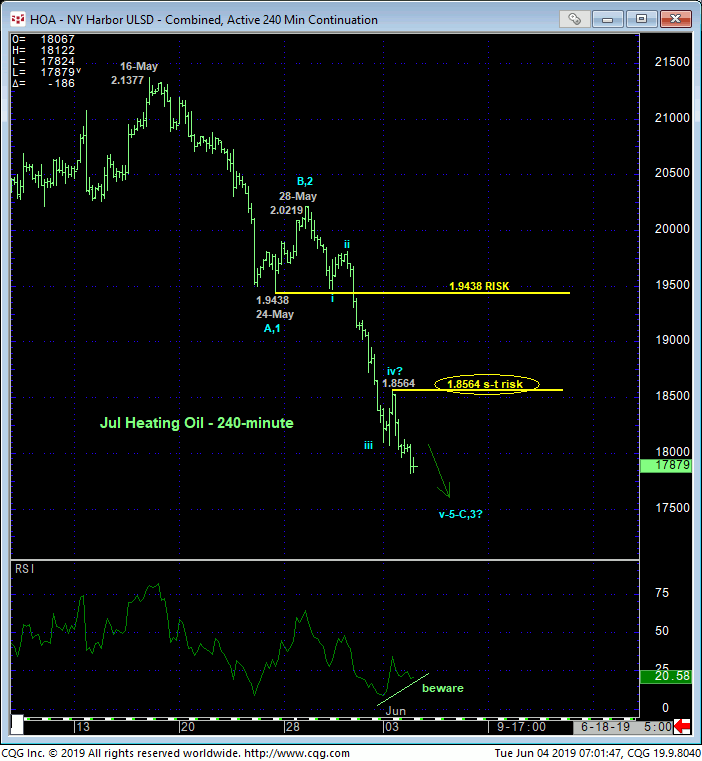
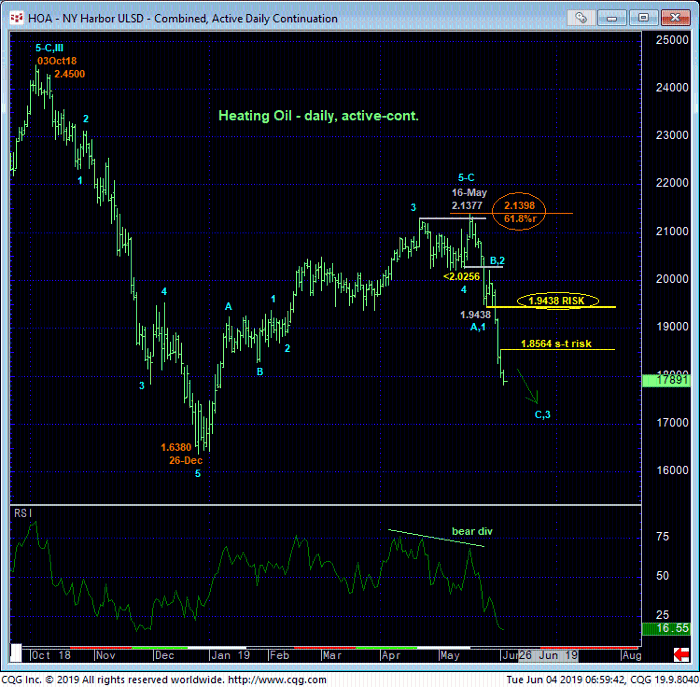
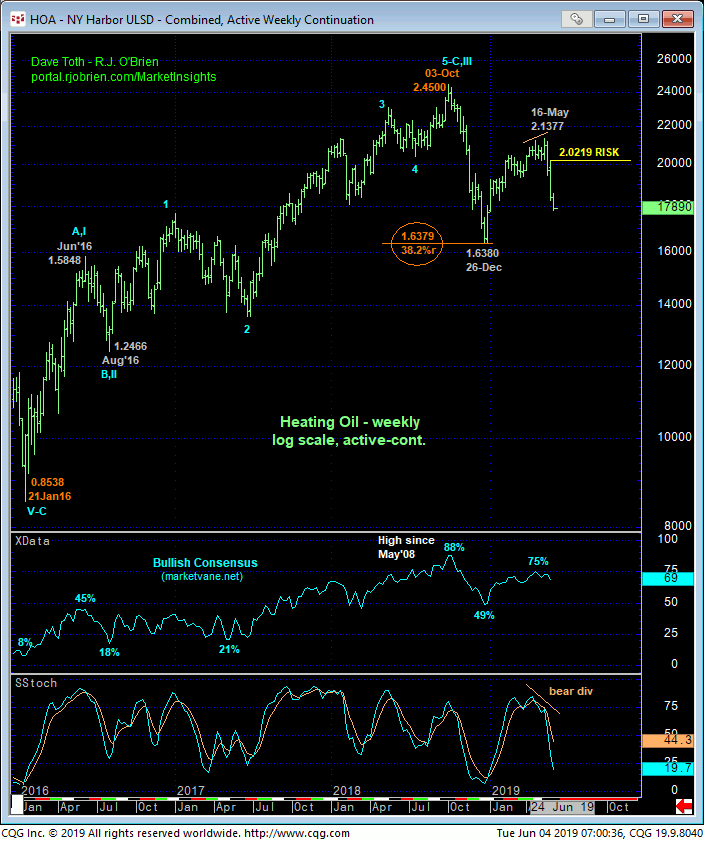
The technical construct and expectations for the heating oil market are identical to those detailed above in RBOB with shorter- and longer-term risk parameters defined at 1.8564 and 1.9438, respectively. Further and possibly accelerated losses remain expected with recoveries above these levels required to threaten or negate this call. In lieu of such strength, further losses remain expected.
JUL CRUDE OIL
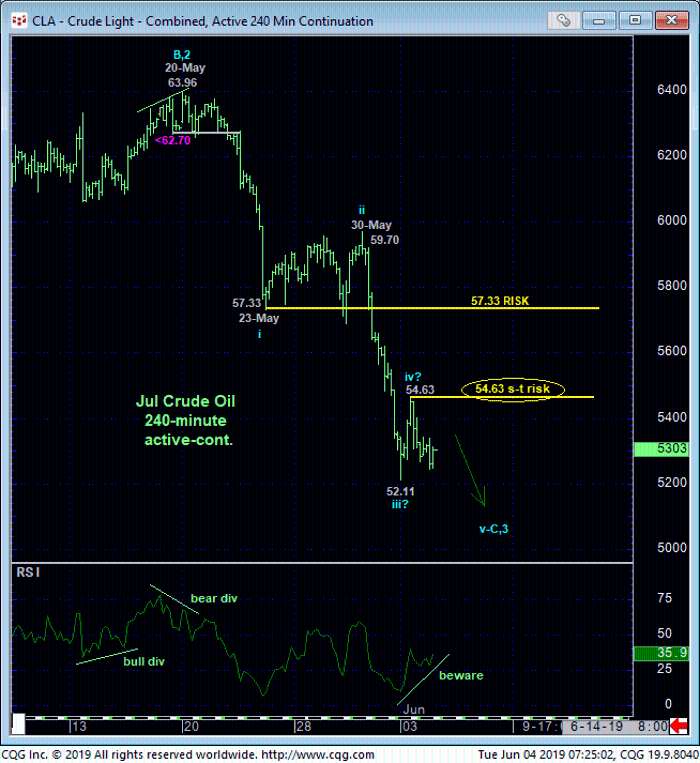
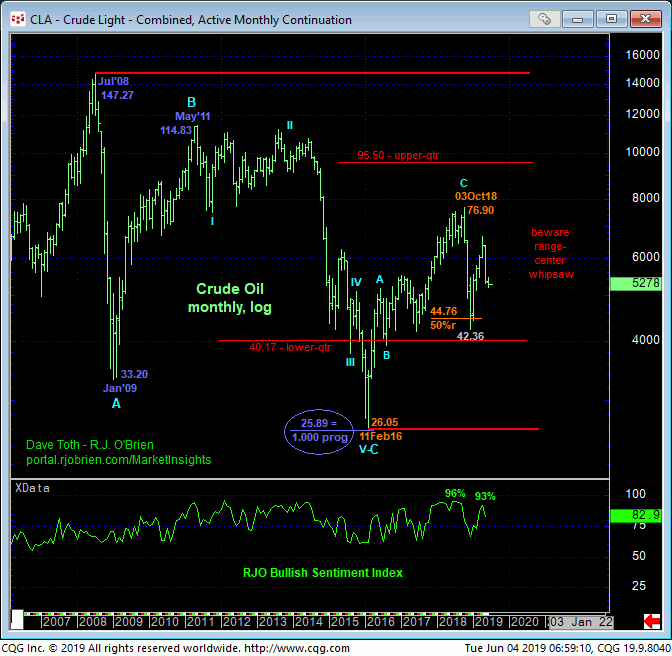
While crude has yet to break Sun night’s 52.11 low, we’re identifying yesterday’s 54.63 high as our short-term risk parameter anyway because a recovery above what would be an initial counter-trend high would confirm a bullish divergence in short-term mo and expose a larger-degree correction or reversal higher. In lieu of at least such 54.83+ strength the trend remains down on any practical scale and should not surprise by its continuance or acceleration. A recovery above 23-May’s 57.33 (suspected 1st-Wave) low is required to jeopardize the impulsive integrity of a broader 5-Wave Elliott sequence down from 20-May’s 63.96 high. Per such this 57.33 level serves as our new long-term risk parameter to a bearish policy for longer-term players.

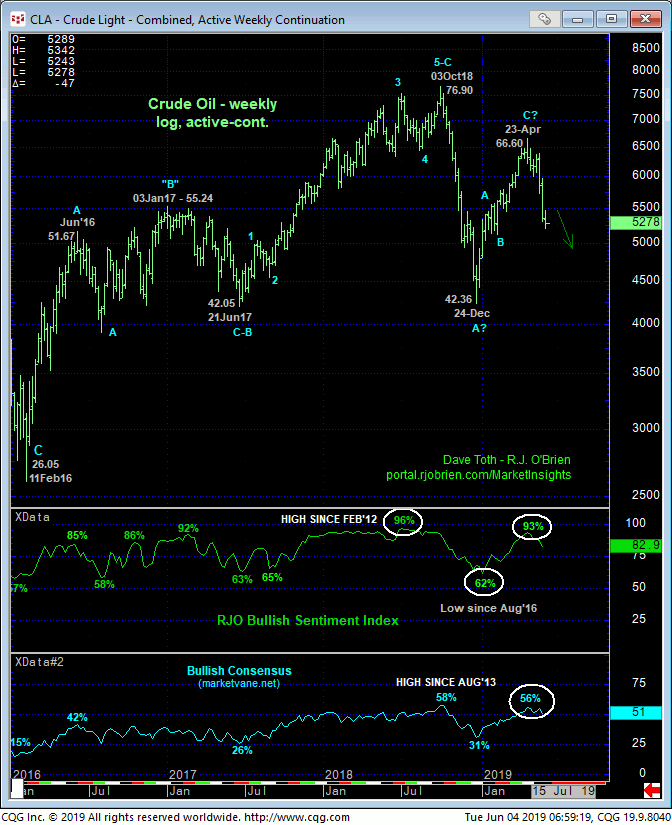
Still-frothy bullish sentiment levels would seem to reinforce a count calling for further downside vulnerability. But the market’s position deep within the middle-half bowels of the 11-YEAR lateral range shown in the monthly log chart below cannot be ignored as a source of aimless whipsaw risk in the period ahead. Herein lies the importance of tighter but objective risk parameters like 57.33 and even a level as tight as yesterday’s 54.63 high.
These issues considered, a bearish policy and exposure remain advised with a recovery above 54.63 required for shorter-term traders to move to the sidelines to circumvent the heights unknown of a correction or reversal higher. Commensurately larger-degree strength above 57.33 is required for long-term players to step aside. IN lieu of such strength further and possibly accelerated losses should not surprise.
