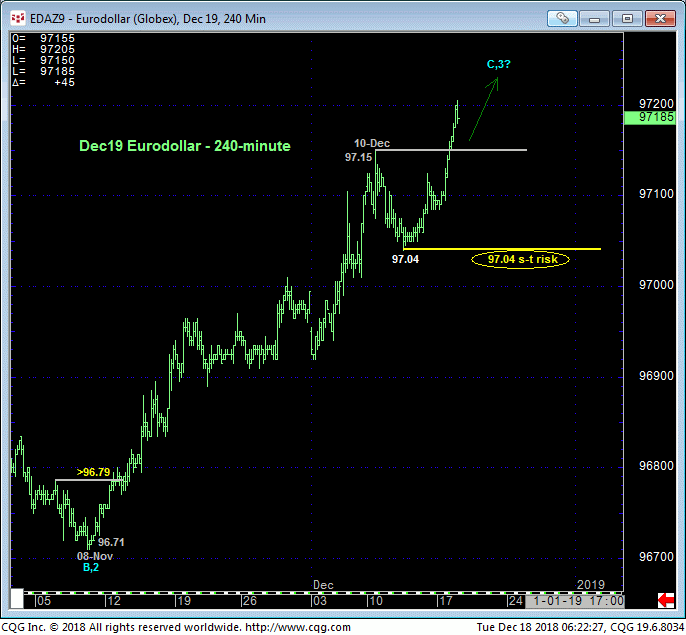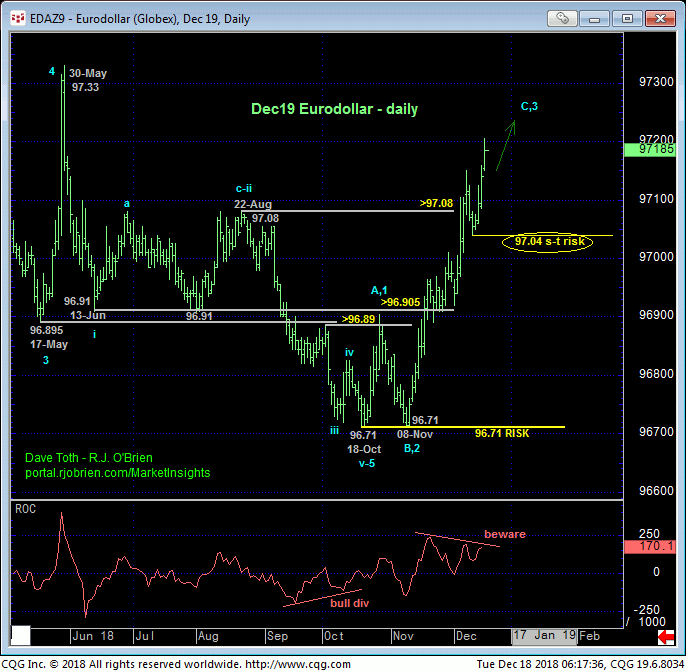

This week’s resumed rally above 10-Dec’s 97.15 high reinforces our bullish count introduced in 09-Nov’s Trading Strategies Blog and leaves last Wed’s 97.04 low in its wake as the latest smaller-degree corrective low the market is now required to fail below to confirm a bearish divergence in momentum needed to stem the uptrend and expose a likely interim correction lower. In lieu of such sub-97.04 weakness the trend remains up on all practical scales and should not surprise by its continuance or acceleration. In this regard this 97.04 low is considered our new short-term risk parameter from which the risk of a bullish policy and exposure can be objectively rebased and managed by shorter-term traders with tighter risk profiles.


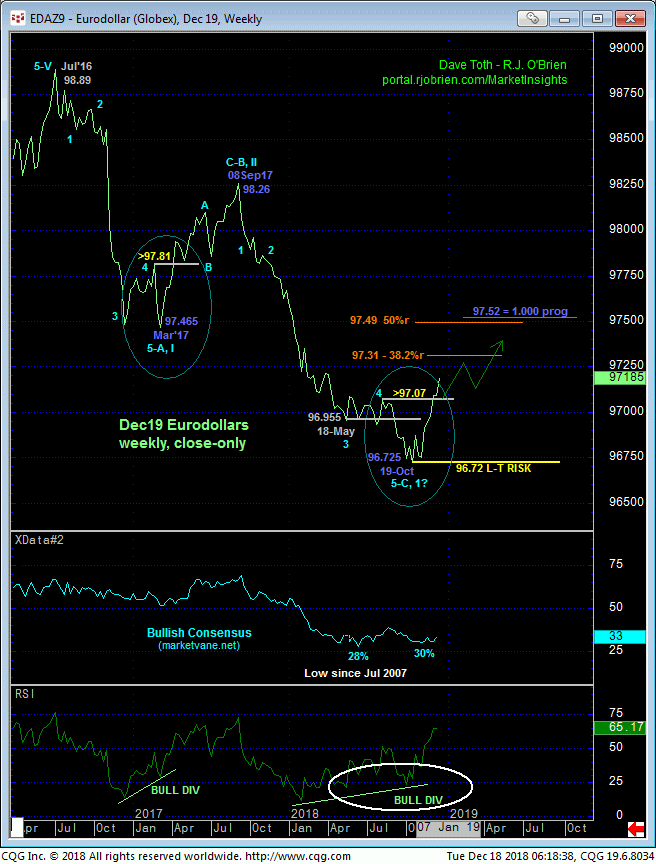
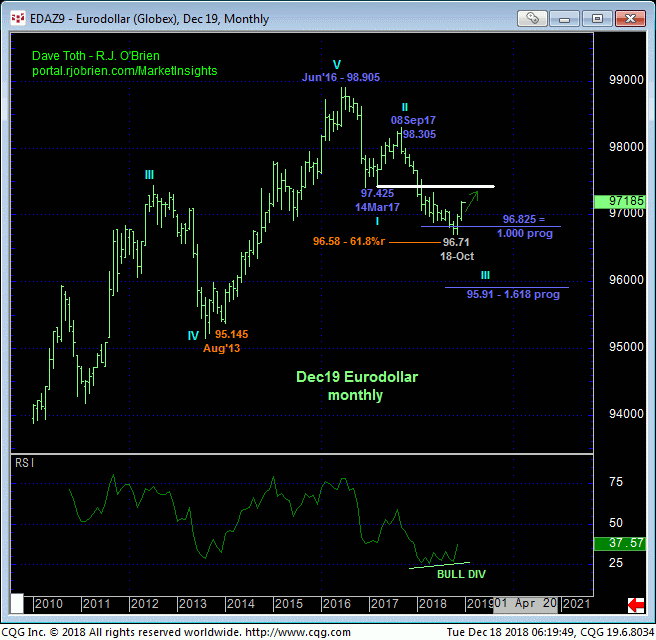
The extent and impulsiveness of this basing behavior that celebrates its 2-MONTH birthday today is impressive because it reinforces a longer-term bullish count that concludes 18-Oct’s 96.71 low (96.725 on a weekly close-only basis above) as THE END of a major 5-wave Elliott sequence from Sep’17’s high. This complete wave count accompanied by a confirmed bullish divergence in MONTHLY momentum amidst historically bearish sentiment not seen in 11 YEARS provides the trifecta of technical evidence of a major base/reversal environment.
So while it’s easy to identify risk parameters below the market that it needs to fail below to defer or threaten a bullish count, what about upside potential? The only legitimate answer at this time is that it is indeterminable and potentially severe as there is no way to know if this rebound is a mere correction of Sep’17 – Oct’18’s decline or a reversal.
IF it’s “just” a correction, we can sight candidates for resistance (as opposed to actual resistance) around the (97.31) 38.2% retrace of the past year’s decline and especially around the 97.50-area identified by Mar’17’s major but now former support that, since broken, would be expected to hold as new resistance. This area also is where the (97.49) 50% retrace of 2017-18’s decline cuts across.
But while such levels are interesting and bear watching, ONLY a confirmed bearish divergence in momentum around one of these areas (or any other for that matter) will suffice in stemming the current recovery and possibly resurrecting the secular bear trend. Until and unless this market fails below a prior corrective low, further and possibly accelerated gains remain expected. And given the quality-flight status of the interest rate markets and gold, such a bullish count doesn’t bode well for equities.
In sum, a bullish policy and long exposure from 96.75 recommended in 09-Nov’s Trading Strategies Blog remain advised with a failure below 97.04 required for shorter-term traders to take profits and move to the sidelines temporarily and for long-term players to pare bullish exposure to more conservative levels to reduce the risk of what would be expected to be an interim correction of indeterminable scope. n In lieu of such sub-97.04 weakness, further and possibly accelerated gains remain expected.


