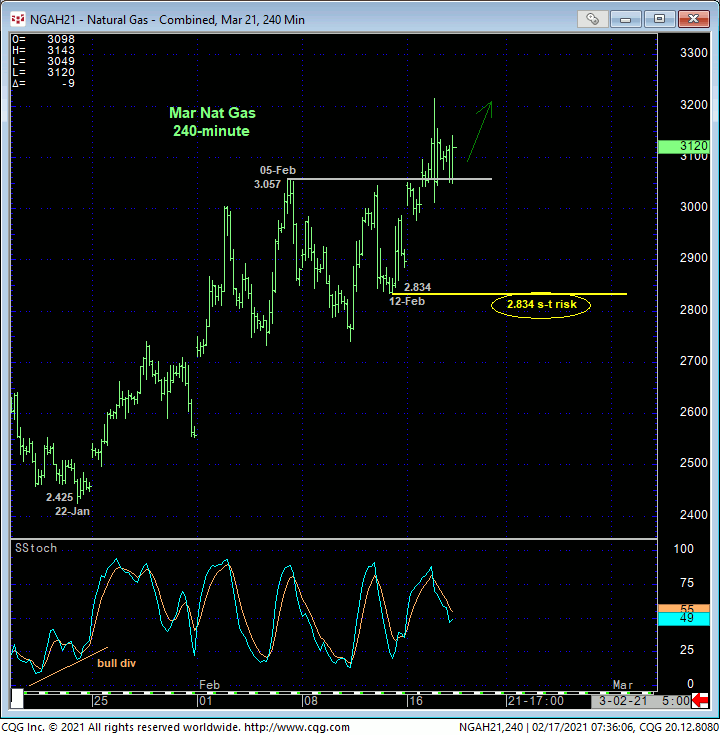
The fact that nat gas is rallying now, in the dead of what’s becoming a more challenging winter than most anticipated, is a surprise to no one. The 240-min chart below shows this week’s break above the prior couple weeks’ resistance around 3.057, with the important by-product being the market’s definition of last Fri’s 2.834 low as the latest smaller-degree corrective low it’s now required to sustain gains above to maintain a more immediate bullish count. Per such, this 2.834 level becomes our new short-term risk parameter from which traders can rebase and manage the risk of a bullish policy.
Generally speaking and because of the market’s position still deep within the middle-half bowels of the massive FIVE YEAR lateral range where the risk/reward merits of directional exposure are abhorrent, we continue to advise a neutral/sideline policy. For those imbedded in this industry who HAVE to make directional decisions, a cautious bullish policy remains advised with a failure below 2.834 required to negate this call and warrant its cover.
Former 3.05-area resistance, since broken, would be expected to hold as new near-term support IF the market has something broader to the bull side in mind.


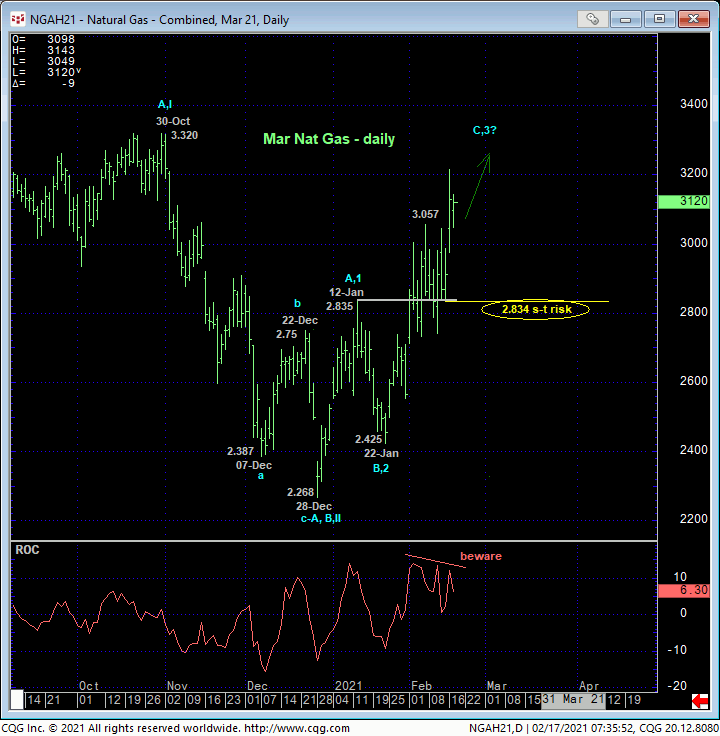
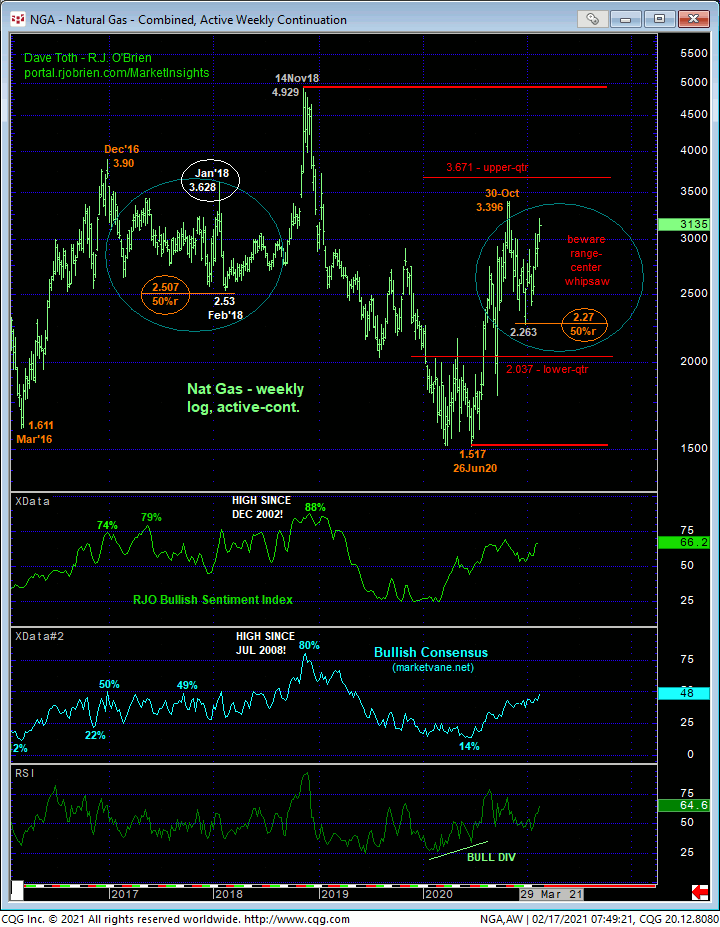
Stepping back, only a glance at the daily chart of the mar contract above is needed to see that the trend is clearly up with a failure below at least 2.834 required to threaten it. The problem or challenge here is that on an even broader scale shown in the weekly log active-continuation basis below, the market remains within the middle-half bowels of the massive five year latera; range between 1.51 and 4.93 where the odds of aimless whipsaw risk are approached as greater. As we’ll address further down, we’ve made the long-term case for a massive BASE/reversal environment from last Jun’s 1.517 low that could span quarters and even years and ultimately produce levels above 4.00 as the past three quarters’ technical facts of:
- historically bearish sentiment/contrary opinion levels
- confirmed bullish divergence in weekly momentum and
- the market’s gross failure to sustain Jun’20’s break below Mar’16’s 1.611 low
are identical to those that warned of and accompanied 2016-to-2018’s 206% reversal. WITHIN that major 32-MONTH reversal however came an extensive, 14-MONTH, 50% retracement from Dec’16’s 3.90 high to Feb’18’s 2.53 low. And- surprise, surprise- this 14-month (B-Wave) correction back down included a dead-of-winter Dec’17/Jan’18 spike to 3.628 before collapsing more than a dollar to Feb’18’s 2.53 end to the correction. This extensive, hair-pulling-out, aimless and frustrating-to-no-end B-Wave correction is circled in blue in the weekly chart below. The debate remains as to how long we might remain within the recent 3.39 – 2.26-range OR f this time will be different and the market is poised for a launch to 4.00+ straight away.
An admittedly short-term mo failure below 2.834 will threaten a more immediate bullish count and raise the odds of a continued extensive (B-Wave) correction back to the 2.25-to-2.00-area we proposed would contain this correction and present favorable risk/reward buying conditions. In lieu of such sub-2.834 weakness, we won’t argue with, dispute or underestimate the clear and present, if intra-range uptrend.

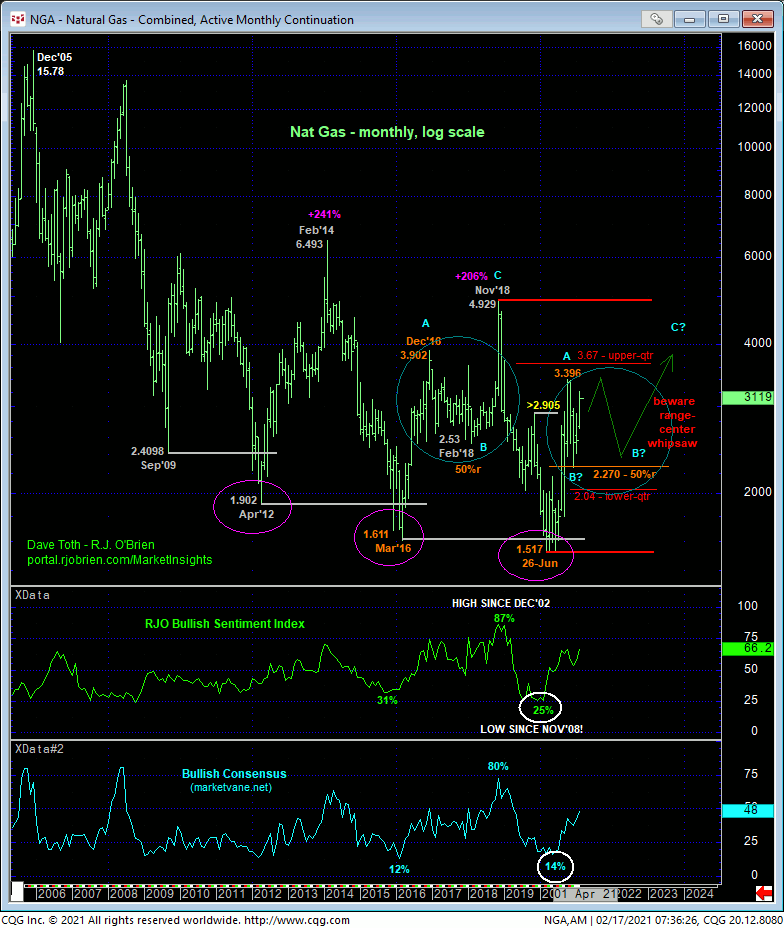
Finally, the monthly log chart below shows the technical elements from last Jun’s 1.517 low that, again, we believe are identical to those that existed around Mar’16’s 1.611 low and ultimately led to a 32-month, 206% reversal higher. The technical and trading challenge now remains one of negotiating the middle-half bowels of the massive multi-year lateral range that remains fertile ground for aimless whipsaw risk
In sum, a neutral/sideline policy remains advised for those outside of the nat gas industry due to the poor risk/reward merits of directional exposure from the middle of the major range. For those imbedded in this industry who HAVE to take or make a directional stand, a cautious bullish policy remains advised with a failure below 2.834 required to threaten or defer this call enough to warrant moving to the sidelines to reduce or remove the risk of a potential relapse to the 2.25-aerewa or lower. In lieu of a relapse below 2.834, further and possibly accelerated gains should not surprise.


