(Please Note: This update intends to only address the technical condition and expectations for the May and Nov bean markets. Given these unique and compelling technical developments, we will follow-up this analysis with a separate blog dedicated to specific option strategies and opportunities to engage Wed’s critical crop report).
MAY SOYBEANS
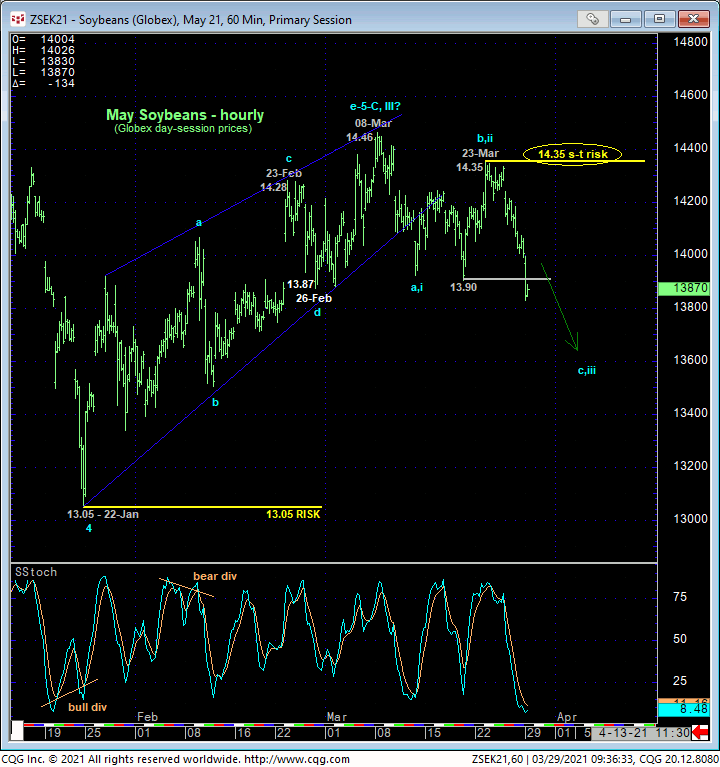
In 12-Mar’s Technical Blog we introduced some broader peak/reversal-threat elements that were developing but were conditional on the market failing below 26-Feb’s 13.887 corrective low and short-term risk parameter. This morning’s failure below both 18-Mar’s 13.90 initial counter-trend low and that 13.87 low, the market has confirmed a bearish divergence in momentum that defines 08-Mar’s 14.46 high as the end of at least the portion of the major bull market from 22-Jan’s 13.05 larger-degree corrective low and possibly the end of a massive 5-wave Elliott Wave sequence that dates from Ar’20’s 8.18 low.
As a result of today’s resumption of early-to-mid-Mar’s initial break, the market has identified last week’s 14.35 high as the latest smaller-degree corrective high it is now minimally required to recover above to arrest the clear and present intermediate-term downtrend, render the sell-off attempt from 14.46 a 3-wave and thus corrective affair and re-expose the secular bull trend. Until and unless such 14.35+ strength is shown, this decline from 14.35 is arguably the 3rd-Wave of a broader developing correction or reversal lower that, for ancillary reasons we’ll discuss below, could be major in scope. Per such, this 14.35 level serves as our new short-term risk parameter from which traders can rebase and manage the risk of non-bullish decisions like long-covers and new bearish punts.
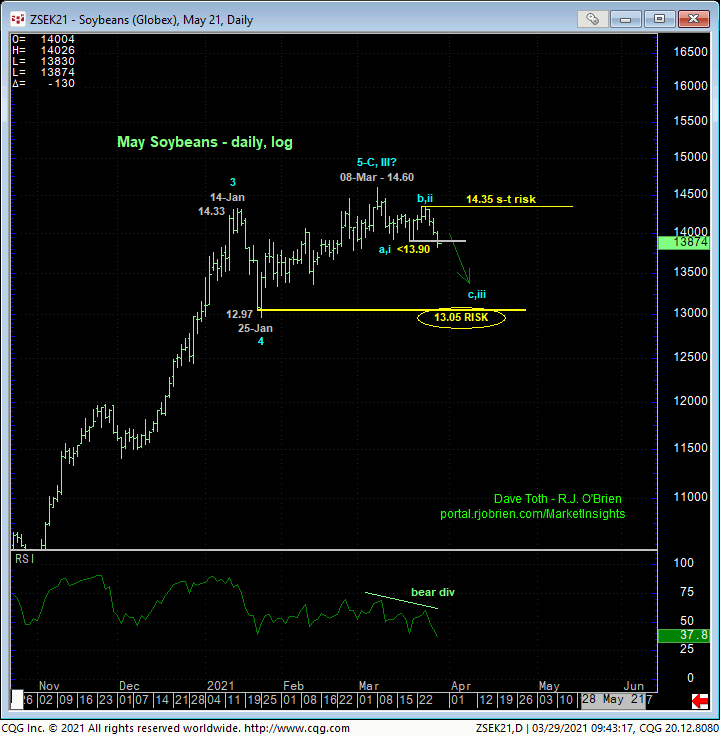
The daily log scale chart above shows the confirmed bearish divergence in momentum. This mo failure reinforces peak/correction/reversal-threat behavior that’s been unfolding for the past MONTH and the end of at least the portion of the bull market from 22-Jan’s 13.05 Globex day-session low. That 13.05 larger-degree corrective low remains intact as our key long-term risk parameter this market has to fail below to, in fact, break the secular bull trend shown in the weekly log active-continuation chart below. But amidst waning upside momentum on a WEEKLY basis as well amidst historically frothy bullish sentiment/contrary opinion levels not seen since 2012’s infamous peak and reversal, it is not hard at all to envision the past few weeks’ admittedly short-term weakness morphing into a major peak and reversal where even a Fibonacci minimum 38.2% retrace of the past year’s uptrend doesn’t cut across until the 11.70-area.
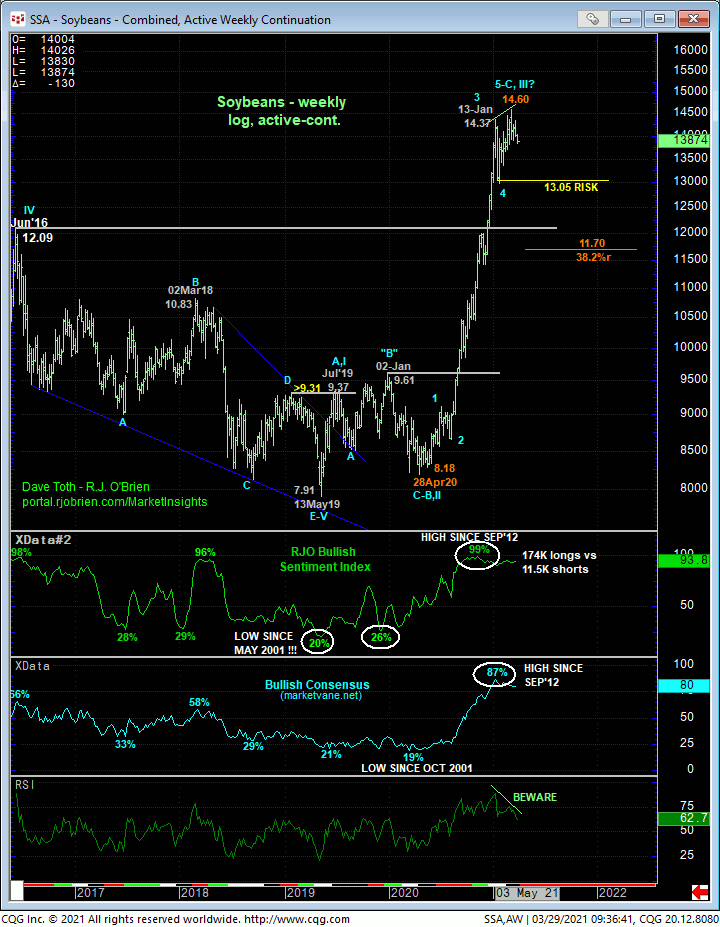
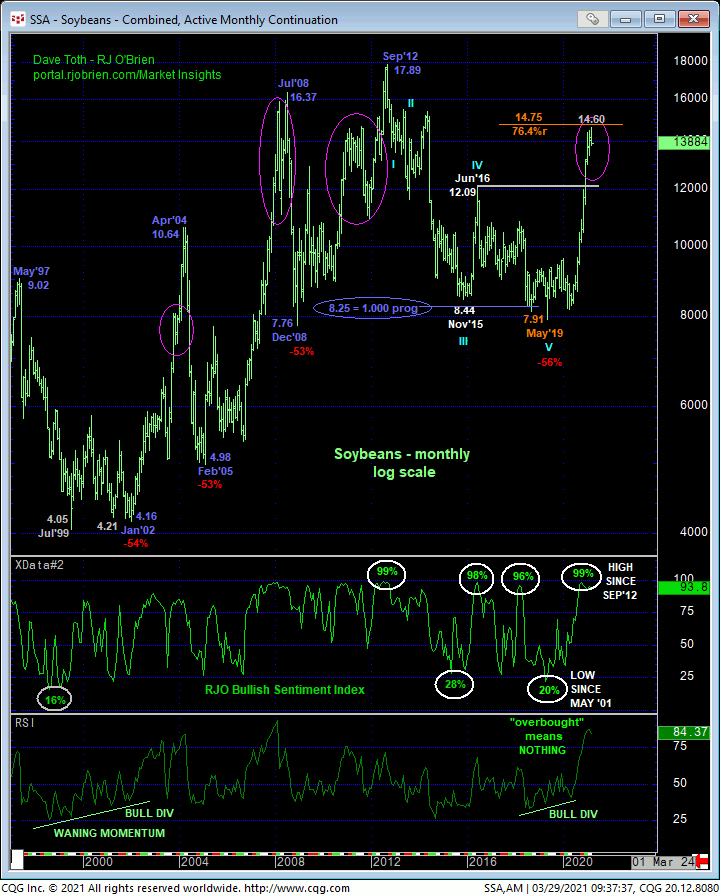
On an even broader basis, the monthly log chart below shows the market’s near 76.4% retrace of 2012 – 2019’s entire 17.89 – 7.91 bear market where at least a major correction similar to those previous examples circled in pink is not hard to envision. While commensurately larger-degree weakness below 13.05 remains required to break the past year’s major uptrend, this combination of:
- a bearish divergence in daily momentum amidst
- historically frothy bullish sentiment not seen since 2012 and
- an arguably complete 5-wave Elliott sequence up from at least 22-Jan’s low and possibly from Apr’20’s 8.18 low
presents an acutely unique and compelling risk/reward opportunity from the bear side. If this call is wrong, all the market needs to do is recover above 14.35. Until and unless such strength is proven, we believe this market may be vulnerable to further and possibly accelerated, even relentless losses straight away. And we only need to look at Wed’s key crop report for a source of grease for the slide.
These issues considered, shorter-term traders have been advised to neutralize bullish exposure and are further advised to establish a new bearish policy and exposure from 13.90 OB with a recovery above 14.35 required to negate this call, warrant its cover and re-expose the major bull. In lieu of such 14.35+ strength, further and possibly accelerated losses should not surprise. Longer-term commercial players are OK to maintain a cautious bullish policy, but this acknowledges and accepts commensurately larger-degree risk to 13.05. Paring or neutralizing bullish exposure around current 13.89-area levels and acknowledging and accepting whipsaw risk above 14.35 in exchange for deeper nominal risk below 13.05 is also an option.
NOV SOYBEANS
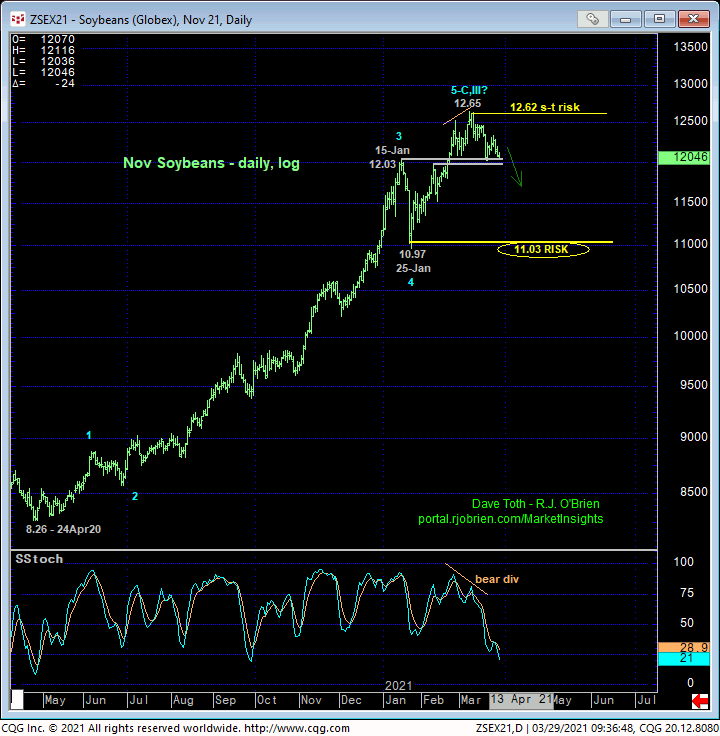
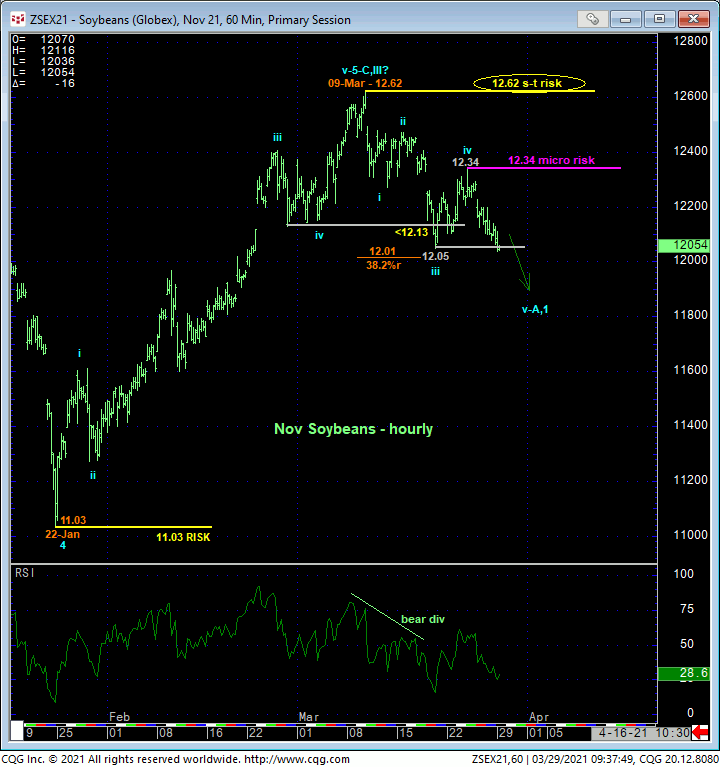
Today’s continued slide below 18-Mar’s 12.05 low reinforces our peak/correction/reversal-threat call in 18-Mar’s Technical Blog that now leaves TWO highs at 12.34 and 12.62 the Nov contract needs to recoup to threaten and then negate this peak/reversal-threat count. Clearly, at least Jan-Mar’s 11.03 – 12.62 uptrend has been broken. What’s at stake now is if this rally is the completing 5th-Wave to a major Elliott sequence from last year’s low.
Stepping back to take in the entire rally from 24Apr20’s 8.26 low in the daily log chart below, commensurately larger-degree weakness below 22-Jan’s 11.03 next larger-degree Globex day-session low remains required to break the 11-month uptrend. And indeed, former 12.00-area resistance from mid-Jan remains arguably intact as a new support candidate within the major bull. But only slightly more weakness below roughly the 11.95-area would chip away at that bullish candidate and leave the market vulnerable to a run at that key 22-Jan low at 11.03. And again, with market sentiment/contrary opinion showing the entire globe’s collective necks skewed historically to the bull side, it is not hard to find fuel for downside vulnerability.
These issues considered, a bearish policy and exposure remain advised for shorter-term traders with a recovery above at least 12.34 and preferably 12.62 required to threaten and then negate this call and warrant its cover. Longer-term commercial players are advised t are bullish exposure to more conservative levels and jettison any remaining exposure on a failure below 11.03. Paring or neutralizing bullish exposure around current 12.05-area prices and acknowledging and accepting whipsaw risk (above 12.62) in exchange for deeper nominal risk below 11.03 is also an option.
