Posted on Jul 28, 2022, 09:36 by Dave Toth
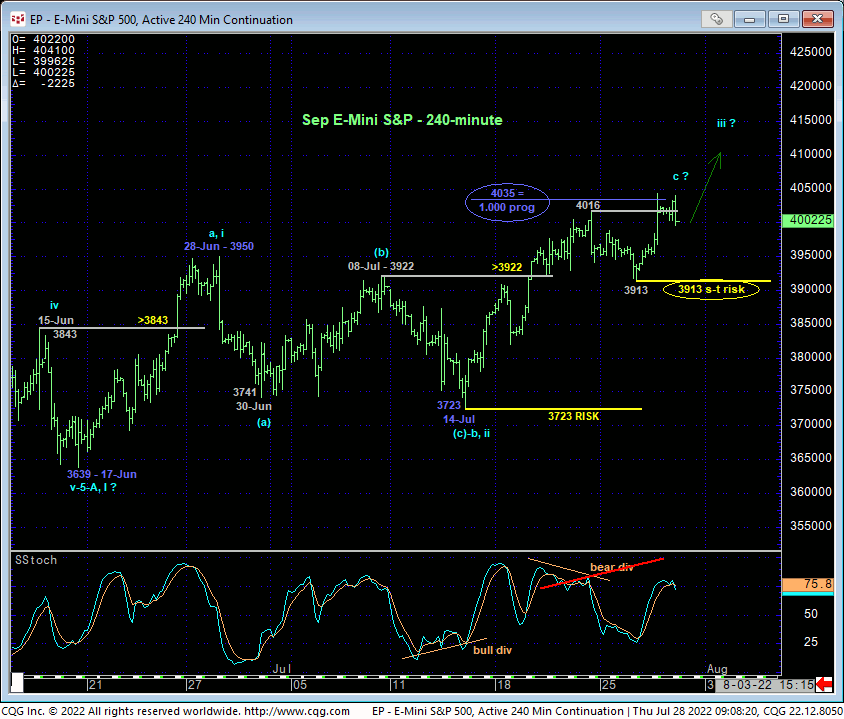
Yesterday’s break above last Fri’s 4016 high reaffirms our interim bear market rally count introduced in 24-Jun’s Technical Blog, with the very important by-product being the market’s definition of smaller- and larger-degree corrective lows at 3913 from Tue and 3723 from 14-Jul as the levels this market now needs to sustain trendy, impulsive gains above in order to maintain a more immediate bullish count. Its failure to do so will threaten and then negate this interim bullish count and re-expose the secular bear trend. Per such, we’re defining these levels as our new short- and longer-term risk parameters from which non-bearish decisions like short-covers and bullish punts can be objectively rebased and managed.

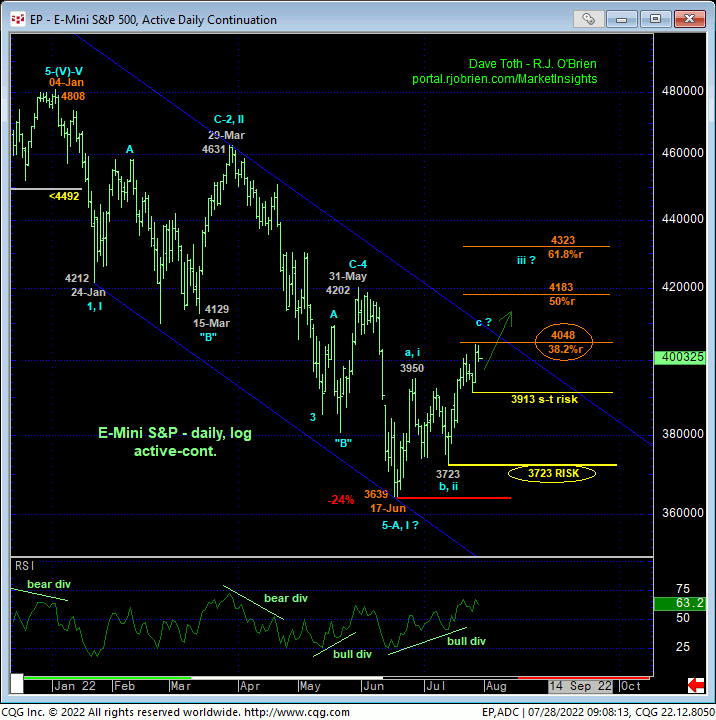
IF a more protracted (2nd-Wave) correction of Jan-Jun’s entire 48008 – 3639 (1st-Wave) decline is what the market has in mind for the next month or so, this now-six-week recovery is at a stage where it should start to ACCELERATE HIGHER in a more trendy, impulsive manner. We say and require this because, to this point, the thus-far-labored recovery from 17-Jun’s 3639 low has only unfolded into a 3-wave structure. Moreover, it is only now engaging an interesting and neighborly pair of Fibonacci retracement and progression relationships at 4035 and 4048 where any bearish divergence in momentum below a corrective low like 3913 could resurrect the broader bear.
In the daily log chart below, 4048 is the 38.2% retrace of Jan-Jun’s entire 4808 – 3639 decline. In the 240-min chart above, the prospective C-Wave rally from 14-Jul’s 3723 low (of a bear market correction) has equaled (i.e. 1.000 progression) mid-to-late-Jun’s initial A-Wave rally from 3639 to 3950, a typical progression relationship for corrections. Alone, we never put any stock into merely “derived” technical levels like Fibs. BUT COMBINED with a rally-stemming bearish divergence in momentum, they raise the odds of a trend change. Per these two Fib levels, Tue’s admittedly tight corrective low and risk parameter at 3913 is very important, the failure below which would threaten our interim bullish count.


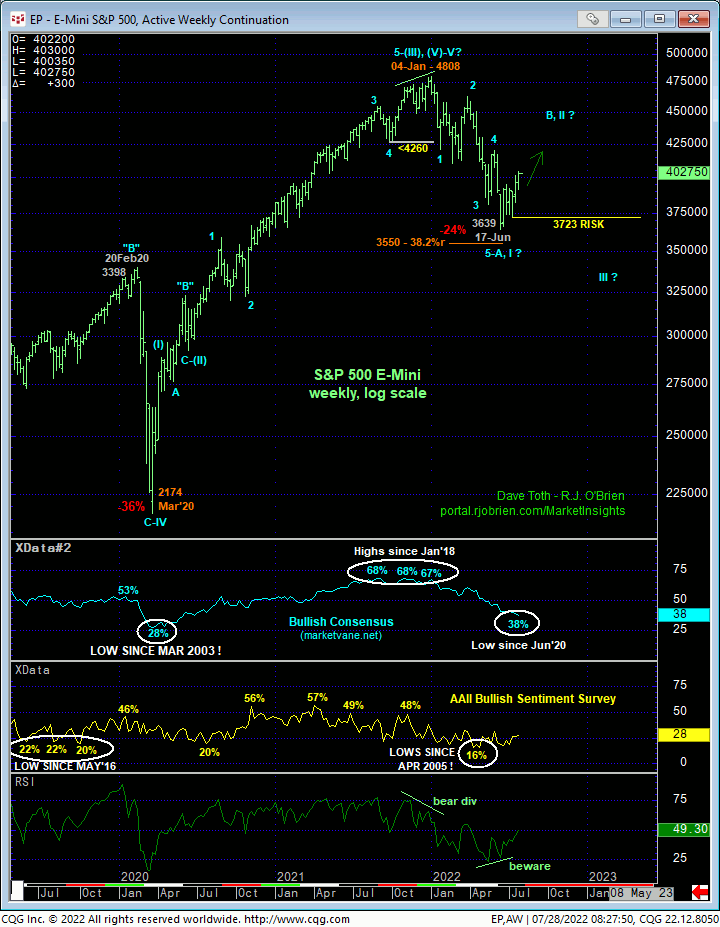
On a longer-term basis and as discussed the past month or so, the weekly log chart above shows:
- he developing potential for a bullish divergence in momentum
- an arguably complete 5-wave Elliott sequence down from Jan’s 4808 high and
- the return to historically bearish sentiment levels not seen in at least two years.
Combined with at least the intermediate-term trend being up, further and possibly accelerated gains should not surprise straight away.
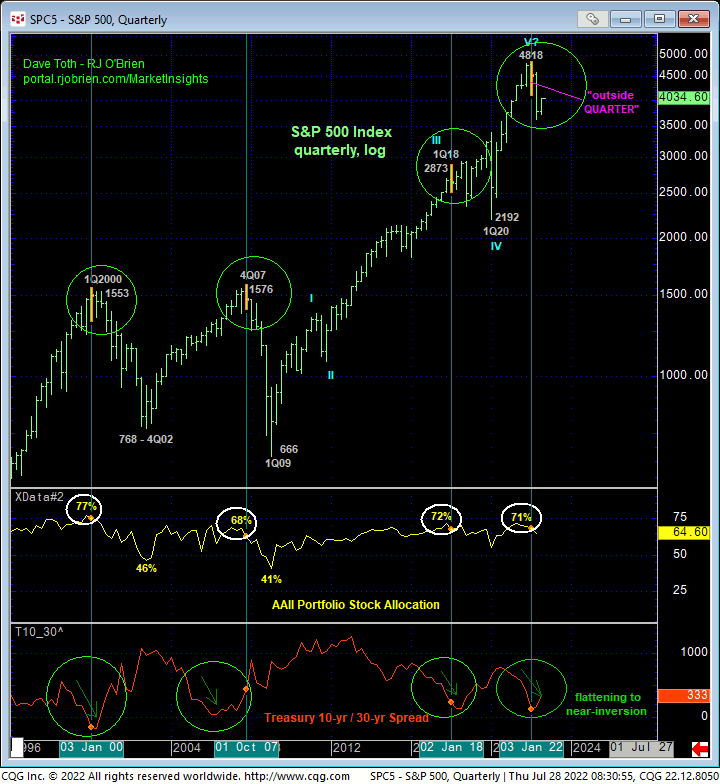
From an even longer-term quarterly log scale perspective below however, long-term players and investors are reminded that the massive peak/reversal/new bear market elements we’ve been discussing since late-Jan remain intact:
- a bearish divergence in monthly momentum
- historically frothy sentiment levels
- historically high equity and equity-to-cash portfolio levels
- the massive flattening to near inversion in the 10s – 30s yield curve, and
- an unheard of “outside QUARTER down” (higher high, lower low and lower close than 4Q21’s range and close).
This is a unique, compelling and massive list of technical factors that have warned of and accompanied the last major correction from 2018-to-2020 and both the 2007 – 2009 and 2000 – 2002 major bear markets. To negate our call and count for a major new multi-year bear market, nothing short of the market’s recovery above Jan’s 4808 high will suffice. And against this long-term peak/reversal backdrop, recovery attempts like the one we’re anticipating now are advised to first be approached as bear market corrections and major selling/total stock liquidation opportunities.
These issues considered, an interim bullish policy and exposure remain advised with a failure below 3913 required for shorter-term traders to neutralize exposure and for longer-term players and investors to pare exposure to more conservative levels. In lieu of such weakness, further and possibly accelerated gains are expected straight away.


