Posted on Dec 13, 2022, 02:39 by Dave Toth

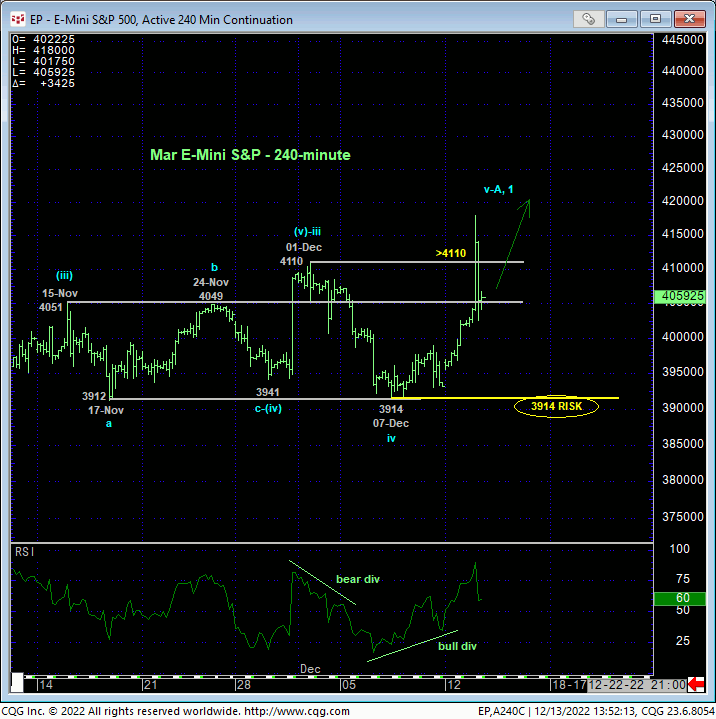
In recent updates we’ve targeted 17-Nov’s 3912 low as the corrective low the market needed to break to confirm a bearish divergence in daily momentum and defer or threaten the impressive recovery from 13-Oct’s 3502 low. As a direct result of today’s resumption of this 2-mponth rally above 01-Dec’s 4110 low, the 240-min chart above shows this 3912-support area holding and 07-Dec’s 3914 low as the latest corrective low this market now is required to sustain gains above in order to maintain a more immediate bullish count. Per such, 3914 is considered our new key risk parameter from which a continued bullish policy and exposure can be objectively rebased and managed. A failure below 3914 is now required to confirm a bearish divergence in daily momentum, break the Oct-Dec uptrend and expose at least a correction of this 2-month rally and possibly a resumption of this year’s major bear market. Until and unless such weakness is proven, further gains remain expected.
This said, it may be notable that with today’s continuation of the rally from 13-Oct’s 3502 low, this rally has virtually mirrored Jun-Aug’s bear market rally from 3639 to 4328. As shown in the daily log scale chart below, 4165 is the 1.000 progression of Jun-Aug’s 3639 – 4328 rally taken from 13-Oct’s 3502 low. Today’s high was 4180. This Fibonacci progression relationship, while interesting, means little until and unless the market breaks the clear and present uptrend with a confirmed mo failure below 3914. Should such a bearish divergence be confirmed, traders and investors will have to reconsider the prospect of this year’s secular bear market resuming.


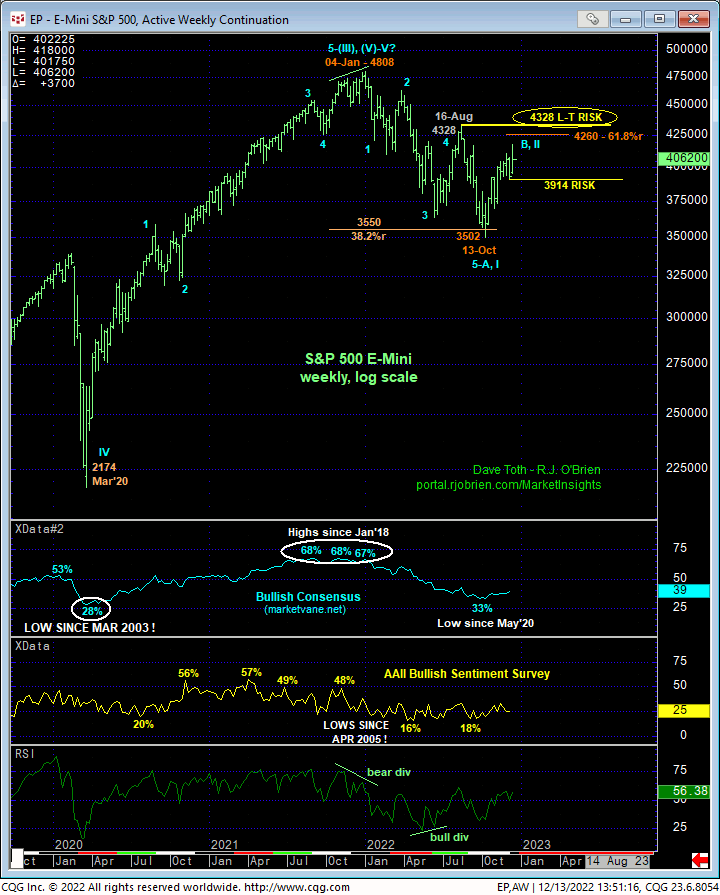
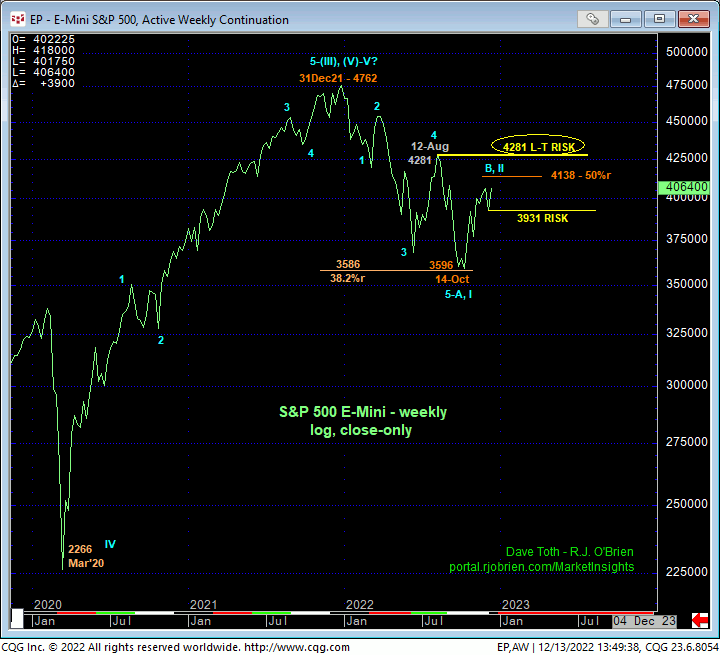
From a longer-term perspective and while the current 2-month recovery is not unimpressive, it remains thus far insufficient to break this year’s broader bear trend. ON a weekly log high-low basis above, the market has retraced nearly 61.8% of Jan-Oct’s 4808 – 3502 decline and has yet to recoup 16-Aug’s 4328 major corrective high needed to, in fact, break this year’s downtrend. On a weekly log close-only basis below, the current recovery attempt has yet to retrace even 50% of this year’s 4762 – 3596 decline. Until and unless this market recoups at least the mid-Aug corrective high, recovery attempts fall well within the bounds of a correction within this year’s major bear trend.

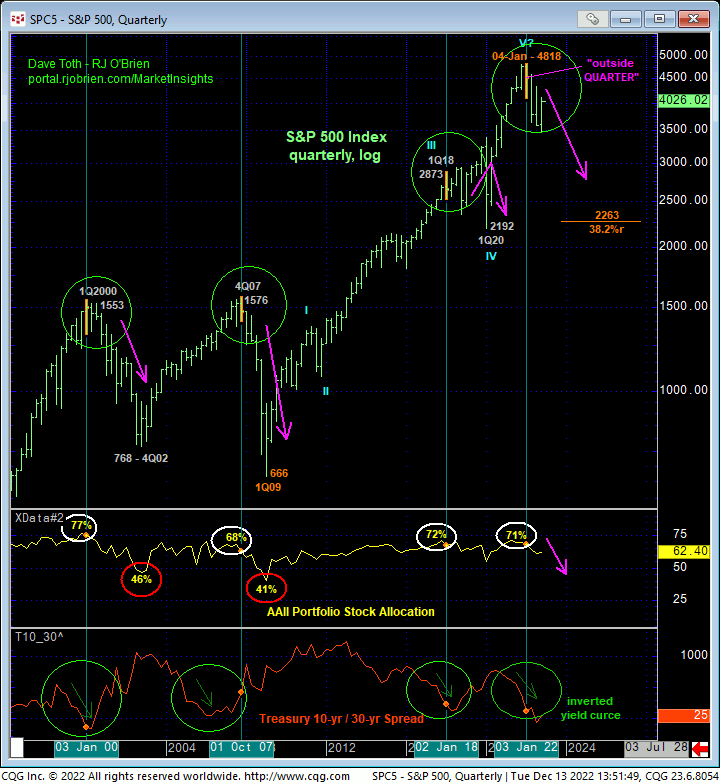
We continue to remain concerned about a major bear market due to the confluence of long-term factors we’ve discussed since late-Jan that warned of and accompanied each of last three major corrections or reversal this millennium as shown in the quarterly log chart below:
- a confirmed bearish divergence in weekly, monthly and quarterly momentum
- “outside” week, month & quarter down the week, month and quarter of Jan’s 4808 high
- historically extreme bullish
sentiment/contrary opinion
- Bullish Consensus
- AAII portfolio equity allocations and equity-to-cash ratio
- inverted Treasury yield curve, and
- an arguably complete and major 5-wave Elliott sequence from 2020’s 2192 low and also from 2009’s 666 low.
This remains a compelling list of factors that warns of a correction or reversal lower that could be major in scope. To even defer this call, let alone threaten it, the market needs to recover above mid-Aug’s 4328 larger-degree corrective high needed to, in fact, break this year’s downtrend. And even then, the market would be a long way away from recouping Jan’s 4808 high-water mark.
These issues considered, an interim bullish policy and exposure remain advised with a failure below 3914 required to threaten this call enough to warrant moving to at least a neutral/sideline position. In lieu of such weakness, further gains should not surprise.


