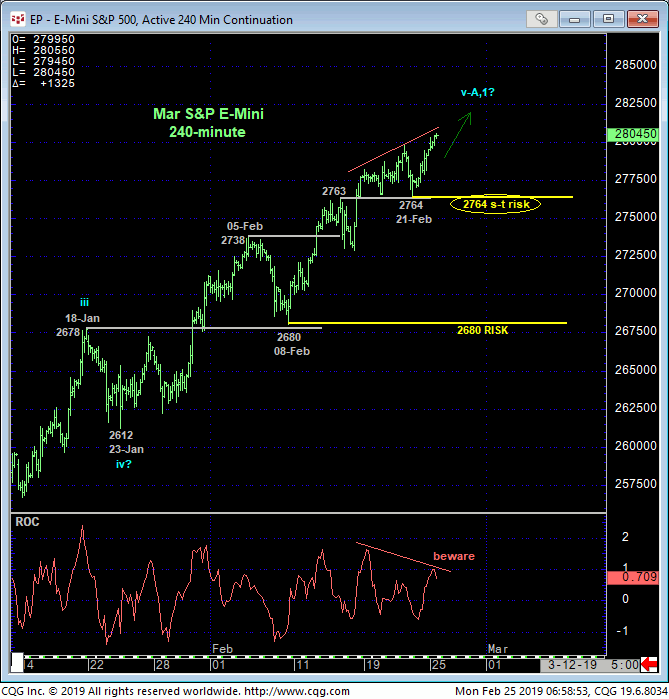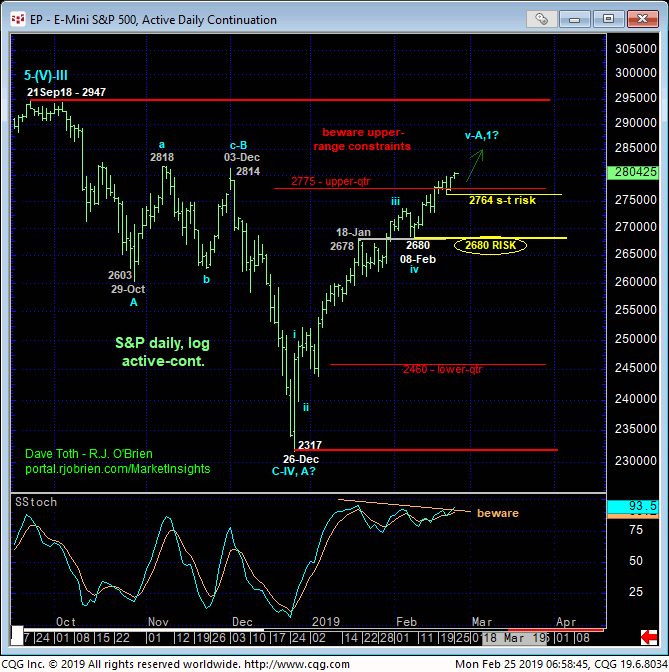
Overnight’s continuation to yet another new high for the impressive, impulsive 2-month recovery from 26-Dec’s 2317 low leaves Thur’s 2764 low in its wake as the latest smaller-degree corrective low the market is required to sustain gains above to maintain a more immediate bullish count “up here”. It’s failure to do so will confirm a bearish divergence in admittedly very short-term momentum. But given the market’s position now in the upper-quarter of the broader 5-month range, even such a minor mo failure cannot be ignored as the start of a more protracted, if intra-range relapse. Per such shorter-term traders are advised to use 2764 as their new short-term parameter from which to rebase and manage the risk of a still-advised bullish policy.


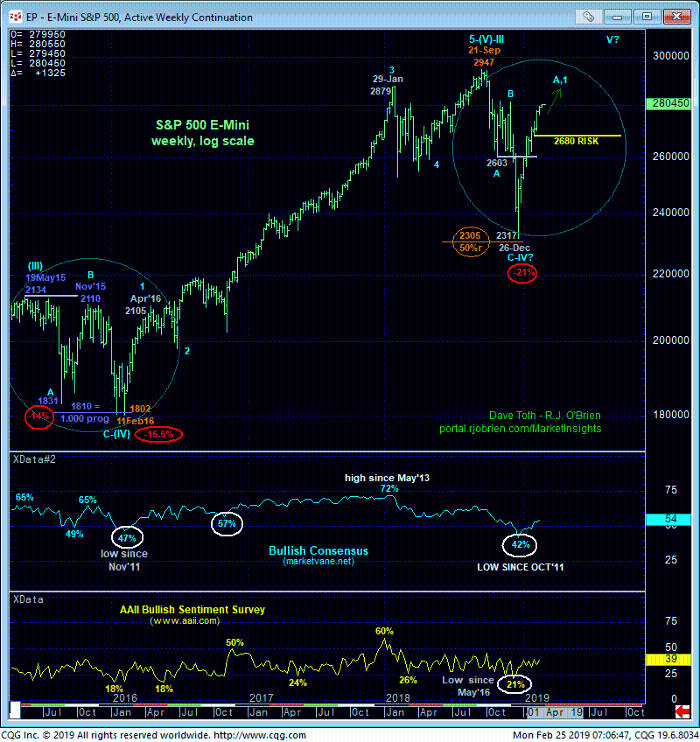
The past couple months’ uptrend has indeed been an impressive and impulsive one that, after a clear 3-wave and thus corrective Sep-Dec meltdown, could still be poised to resume the secular bull market to new highs above 21Sep18’s 2947 al-time high. But this rally is no less impressive than that from Aug-Nov’15’s recovery from 1831 to severely pressure May’15’s 2134 high before succumbing sharply to the throes of a broader consolidation range that produced another meltdown to 11Feb16’s ultimate end of the correction at 1802.
If there’s a time and place to be watchful for another such slippery slope, it is here and now and from the upper-quarter of the 5-month range. We will not be able to conclude another such major relapse from just a short-term mo failure below 2764. Indeed, commensurately larger-degree weakness below 08-Feb’s 2680 next larger-degree corrective low and our key longer-term risk parameter remains required. But a failure below 2764 would be enough of a start to such a threat that shorter-term traders would have the opportunity to objectively pare or neutralize bullish exposure. In lieu of such weakness, further and possibly accelerated gains remain expected that warrants maintaining a bullish policy and exposure.


