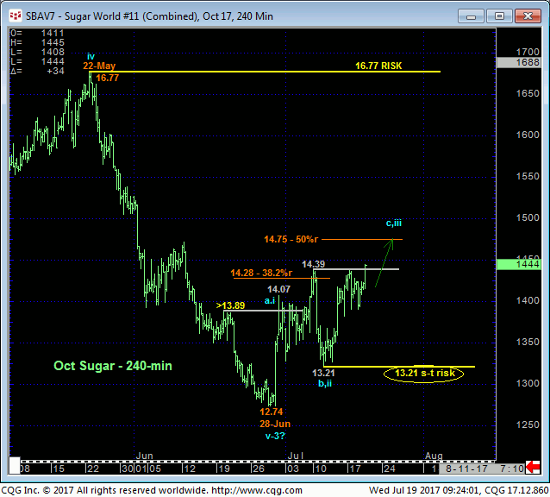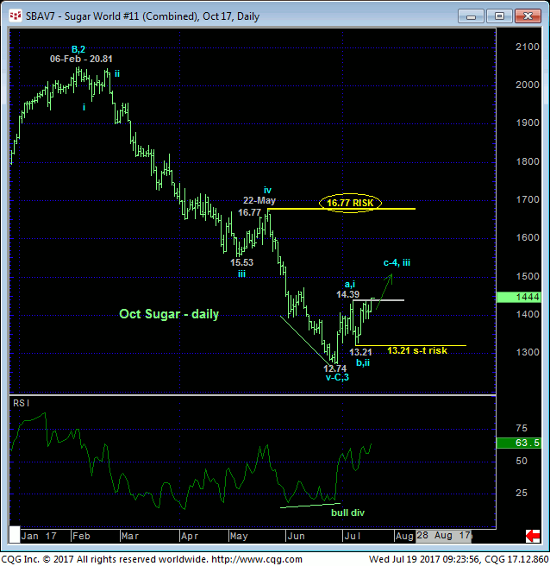
Today’s break above 10-Jul’s 14.39 initial counter-trend high confirms at least the intermediate-term trend as up and reinforces our base/reversal all introduced in 03-Jul’s Trading Strategies Blog. As a direct result of this resumed strength the 240-min chart below shows that the market has identified 11-Jul’s 13.21 low as the latest smaller-degree corrective low the market now needs to sustain gains above to maintain a more immediate bullish count. Its failure to do so would render the recovery from 28-Jun’s 12.74 low a 3-wave and thus corrective affair that might then resurrect the broader downtrend from Sep’16’s 24.10 high. In this regard 13.21 becomes our new short-term parameter from which the risk of non-bearish decisions like short-covers and cautious bullish punts can be objectively rebased and managed.


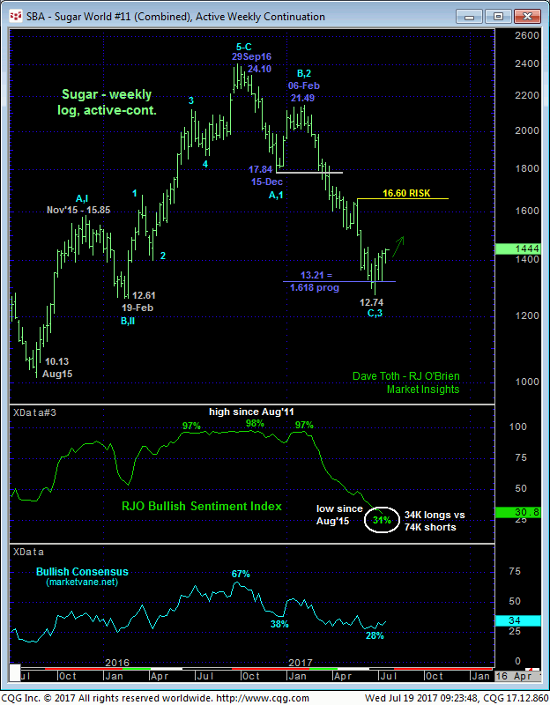
The really compelling thing here is the unique combination of a confirmed bullish divergence in momentum while market sentiment is so historically bearish. Of course, the huddled masses being bearish at major market bottoms (and bullish at major market peaks) is hardly unique, it happens all the time. And we use this contrary opinion indicator extensively in our analysis. We have seen recent major moves counter to the consensus opinion and position in USDCAD, cotton and beans/meal with additional setups developing in cattle, hogs and coffee.
WHILE a market is trending, such gross bearish (or bullish) sentiment doesn’t matter as it’s not an applicable technical tool. But the moment the market stems that trend with a momentum failure, the combination of that mo failure and extreme sentiment is a powerful that presents a unique and favorable risk/reward trading opportunity. This is exactly the case now in sugar as the market has now identified TWO lows at 13.21 and 12.74 that contribute to a basing argument and, most importantly, define specific risk parameters from which even an interim bullish policy and exposure can be objectively based and managed.
These issues considered, longs from 13.93 OB recommended in 03-Jul’s Trading Strategies Blog are advised to be maintained with protective sell-stops trailed to 13.20. Further and possibly surprising gains are anticipated straight away with former 14.39-to-14.00-area resistance considered new near-term support. We believe the market’s upside potential to be indeterminable and potentially extreme.


