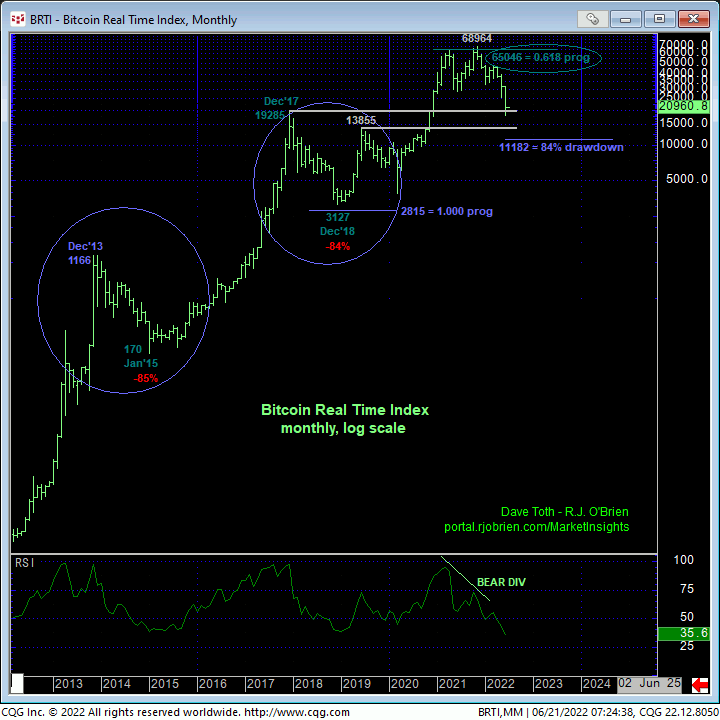
As a direct result of this week’s continuation of the major bear trend below last week’s 20086 low, the 240-min chart below shows that the market has identified last Thur’s 22945 high as the latest smaller-degree corrective high it is now minimally required to recoup to confirm a bullish divergence in short-term momentum, complete a 5-wave sequence down from 31-May’s 32354 larger-degree corrective high and expose at least a correction of this portion of the secular bear trend. Per such, this 22945 level serves as our new short-term risk parameter from which shorter-term traders with tighter risk profiles can objectively rebase and manage the risk of a still-advised bearish policy and exposure. Until and unless such 22945+ strength is shown, a continuation of the major bear trend should not surprise.
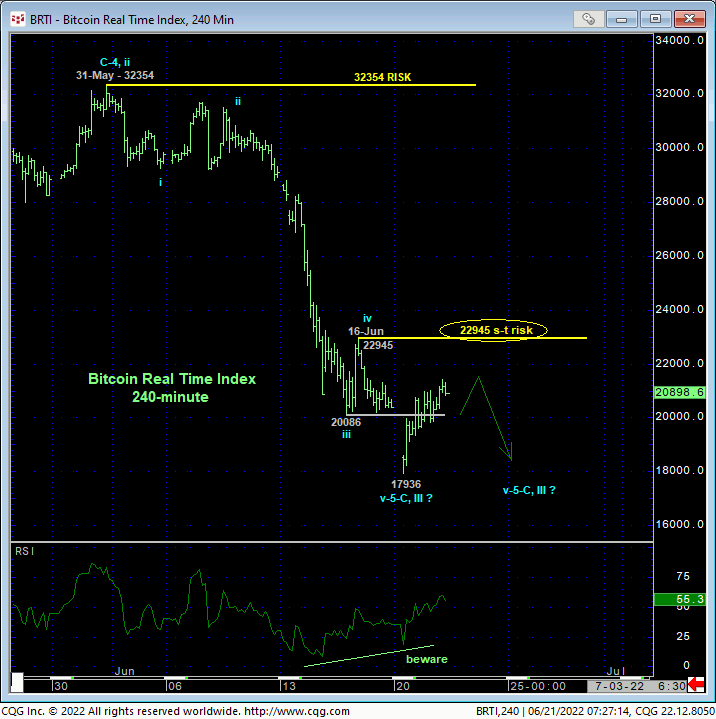
On a broader scale and reinforced by the extent and impulsiveness of the past couple weeks’ plunge, 31-May’s 32354 larger-degree corrective high stands out as THE corrective high and risk parameter this market needs to recoup to break even the portion of the major bear from 28-Mar’s 48211 high, let alone threaten the secular bear trend from last Nov’s 68964 all-time high. Per such, this 32354 level remains intact as our key long-term bear risk parameter pertinent to longer-term institutional players and investors.
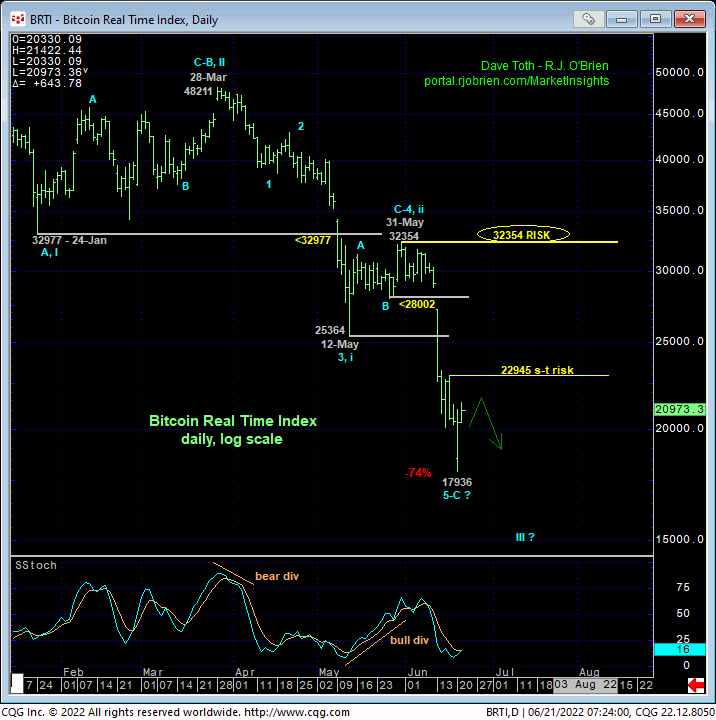
This weekly log chart below, as well as the monthly log charts farther down, show a number of “derived” (in this case Fibonacci retracement and progression) so-called “technical levels” that we’ve listed as areas of interest with respect to the market’s downside potential. Long-time readers of our analysis know of our extensive use of Fibonacci relationships that we always reference in concert with requisite confirmed divergences in momentum needed to, in fact, arrest the clear and present trend at the time. Without such a confirmed momentum divergence needed to render these or any other derived technical level applicable, they are relatively useless in trying to identify support (in this case) and especially forecasts. ALL derived levels like trend lines, Bollinger Bands, imokus, the ever-useless moving averages and even the vaunted Fibonacci relationships we cite often mean little if anything in the absence of an accompanying bullish (in this case) divergence in momentum.
The 19419 level listed in light blue below is the 1.000 progression relationship of 2019 – 2020’s 72% drawdown from 13856 to 3901 taken from Nov’21’s 68964 high. Alone, this fact is nothing more than interesting. COMBINED with a bullish divergence in momentum above at least 22945 and especially 32354, this Fib relationships could reinforce a resumed long-term bullish turn. Without such an accompanying momentum failure, this merely derived level should be taken with no greater a grain of salt than other derived levels we’ve listed ranging from 16403 to 11182.
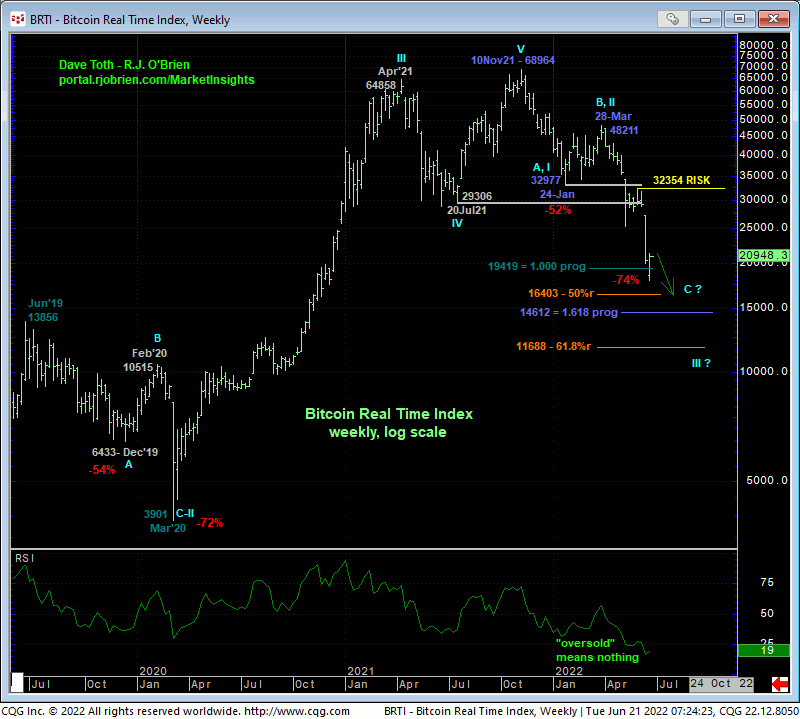
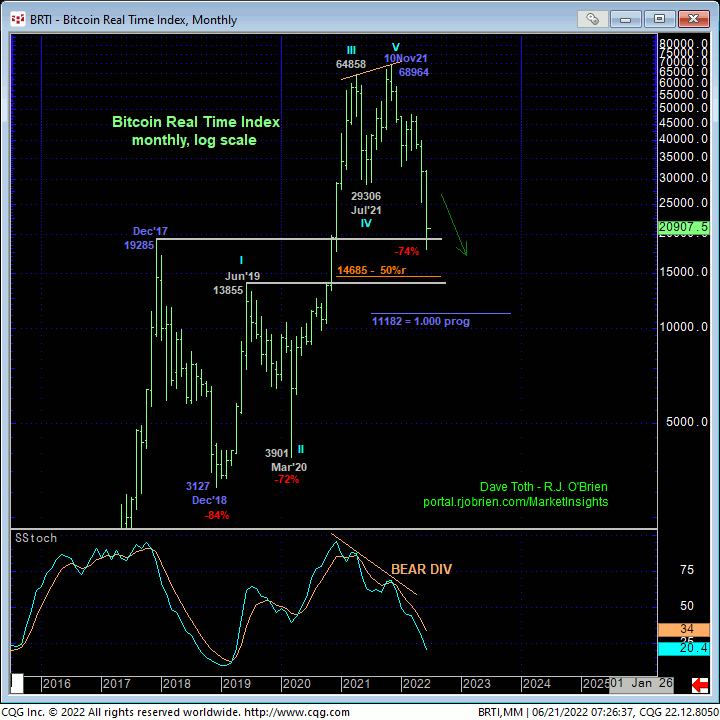
Finally, moving out to an even broader scale, the monthly log charts above and below show the current bear trend relative to previous major reversals as well as the past 4-1/2-years’ price action. Both charts show the current downtrend engaging key former resistance between 19285-to-13855 from Dec 2017 and Jun’19 until Nov/Dec’20’s breakout that left it a new support candidate. If there’s a time and place for the bull to arrest the past 7-month decline with a bullish divergence in momentum, it is here and now. Herein lies the importance of identifying short- and long-term bear risk parameters at 22945 and 32354. Until and unless such strength is shown, there’s no way to know that this current 7-month decline won’t pursue a similar path to BOTH the previous major corrections from Dec’13’s high and Dec’17’s high that spanned 12/13 months and lost 84%/85% in value. A similar 84% drawdown, for what such a derived assessment is worth, projects to the 11182-area.
Is this our forecast? No. Our forecast is for further, indeterminable losses until this market recovers above at least 22945 (for short-term traders) and preferably 32354 (for long-term players). Such losses could include further weakness to the 16403-area (50% ret 2020 – 2021 rally), 146120-area (1.618 progression of Nov-Jan’s 68964 – 32977 1st-Wave decline from 28-Mar’s 48211 2nd-Wave high), 11688-area (61.8% ret 2020 – 2021 rally), 11182 (84% drawdown), OR MORE.
While there remains no way to know this market’s remaining downside potential, what we CAN state with specificity is where the broader bear should NOT trade per ANY amount of continued downside potential: above 22945 for short-term traders and above 32354 for long-term players. In other words, the RISK of a continued bearish policy and exposure is clearly and objectively defined. Until and unless such strength is proven, further and possibly prolonged, accelerated losses remain expected, including a run at or even through the 11000-handle-area.
