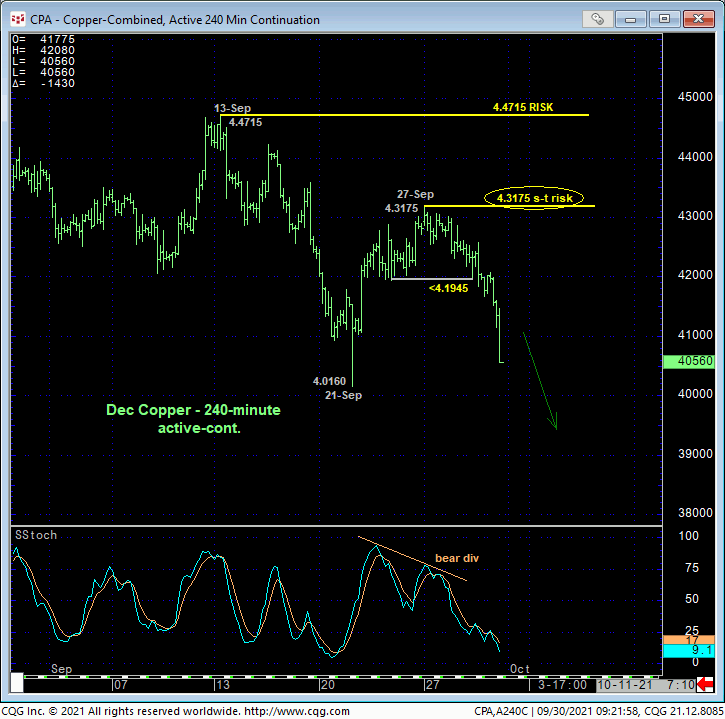
We discussed some weakness and vulnerability in 20-Sep’s Technical Blog that threatened some constructive behavior from mid-Aug-to-early-Sep. The extent and impulsiveness of today’s breakdown on the heels of yesterday’s bearish divergence in very short-term momentum below 23-Sep’s 4.1945 corrective low detailed in the 240-min chart below not only reinforces a bearish count stemming from the weakness discussed in our last update, but threatens the resumption of a peak/reversal process from 10-May’s 4.8880 high that could be major in scope. Per such and as shown below, the market has identified Mon’s 4.3175 high and 13-Sep’s 4.4715 high as the latest smaller- and larger-degree corrective high that now serve as our new short- and long-term risk parameters from which a bearish policy and exposure can be objectively based and managed. In lieu of a recovery above these levels, further and possibly protracted losses straight away are anticipated.


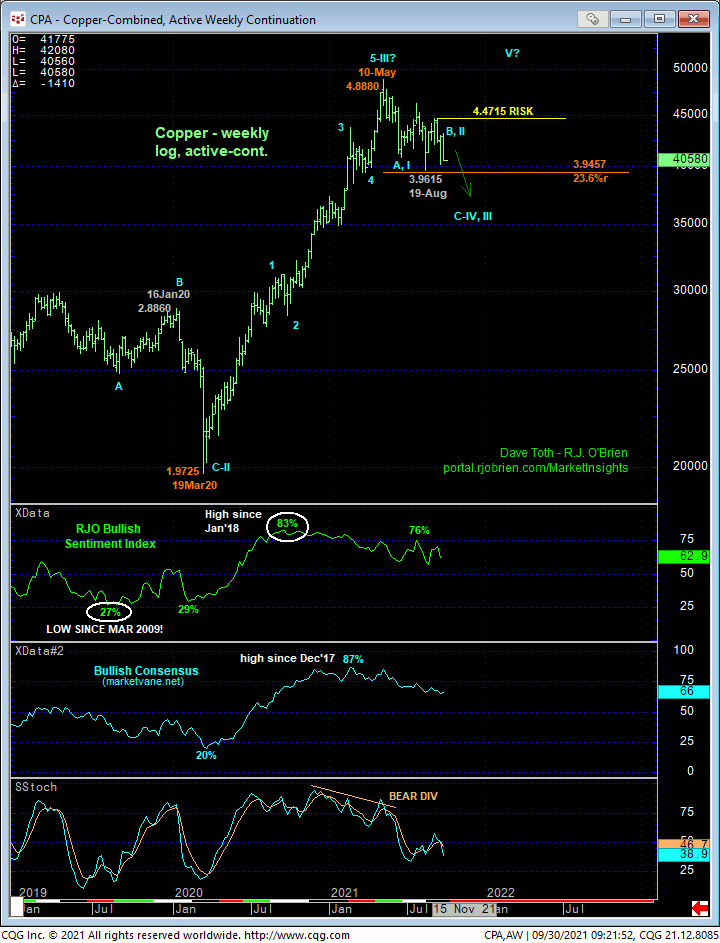
On a broader scale and following May-Jun’s initial counter-trend decline that threatens the secular bull trend, the past three months’ mere lateral chop looks to be about as corrective and consolidative as it gets, warning of a resumption of May-Jun’s initial decline. Today’s break below 20-Sep’s 4.1145 clos confirms at least the intermediate-term trend as down and leaves only 19-Aug’s 4.0410 low close standing between the market and NO levels of any technical merit below that point with the exception of that day’s 3.9615 intra-day low.
Indeed, the weekly log chart below shows NO levels of any technical merit below 19-Aug’s 3.9615 low, the break of which exposes an abyss where a major peak/reversal count will be reaffirmed. And given the magnitude of Mar’20 – May’21’s secular bull trend, the extent of the market’s vulnerability below 3.9615 could be equally massive.

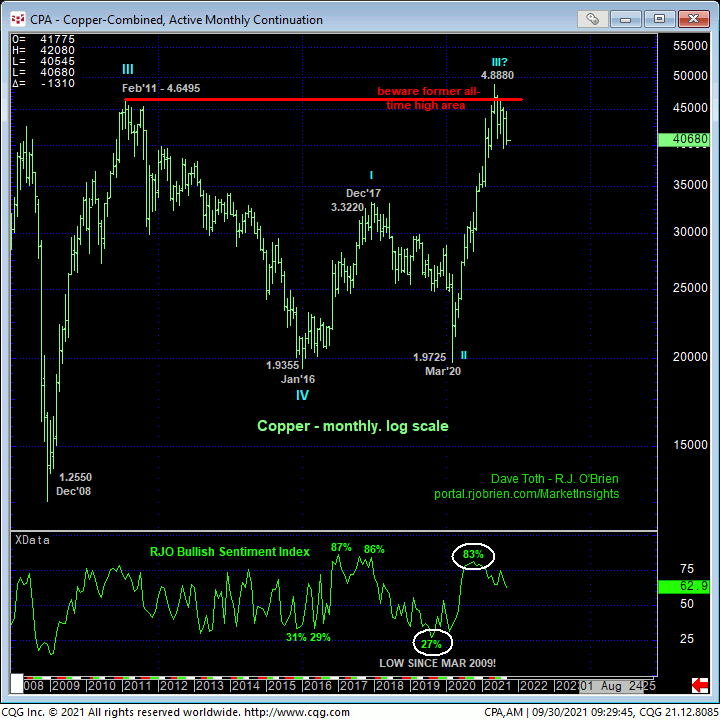
Finally, the monthly log chart below shows the market’s May’21 break above Feb 2011’s previous all-time high of 4.6495 and its failure thus far to sustain those gains. All these factors considered, it’s not hard to see the developing prospect for a peak/reversal threat that could be major in scope. Per such, traders are advised to move to a new bearish policy and first approach recovery attempts to the 4.1350-area OB as corrective selling opportunities with a recovery above 4.3175 required to negate this specific call and warrant its cover. In lieu of at least such 4.3175+ strength, further and possibly accelerated, even relentless losses in the weeks and months ahead should not surprise.


