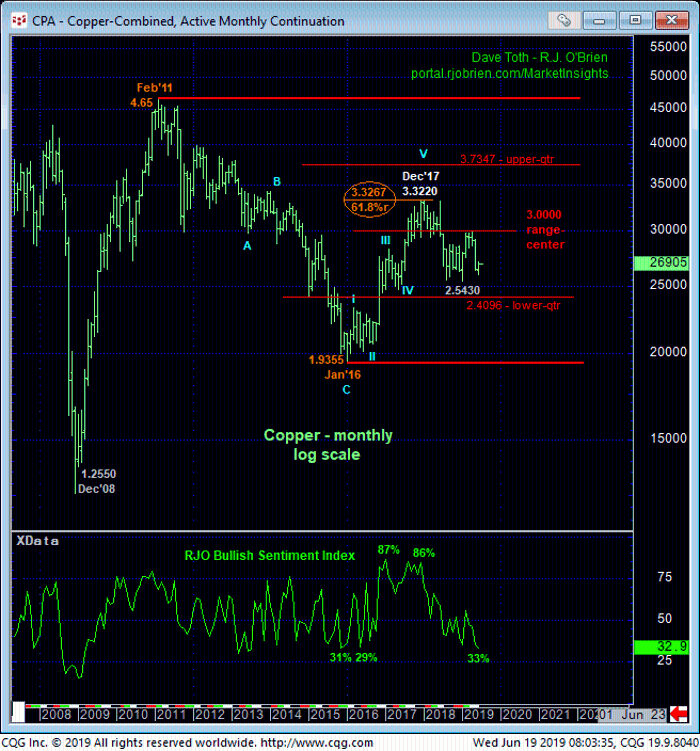
Yesterday’s break above 11-Jun’s 2.7020 initial counter-trend high reinforces our base/correction/reversal count introduced in 11-Jun’s Technical Blog following that day’s bullish divergence in momentum above 2.6745. This resumed strength leaves smaller- and larger-degree corrective lows in its wake at 2.6155 and 2.5995, respectively, that now serve as our new short- and longer-term risk parameters from which to base non-bearish decisions like short-covers and cautious bullish punts.
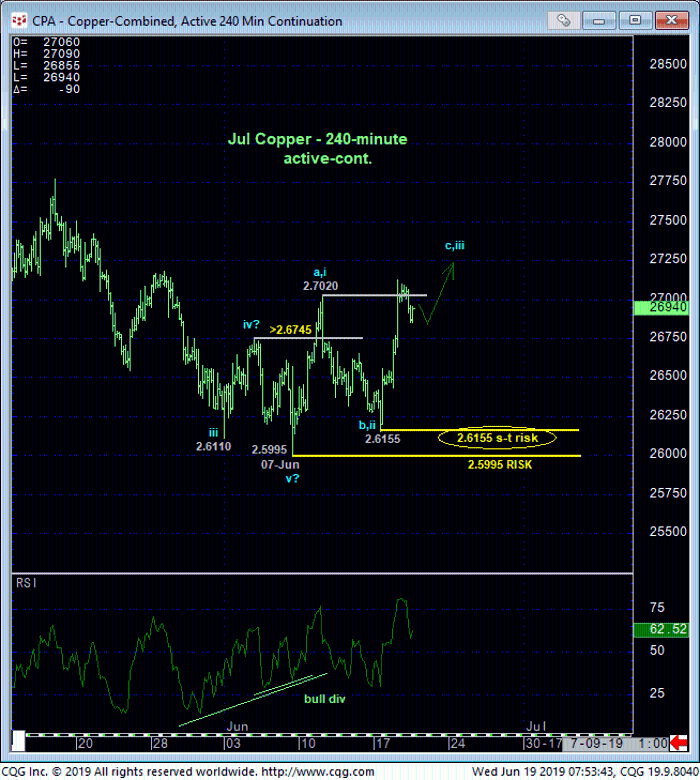
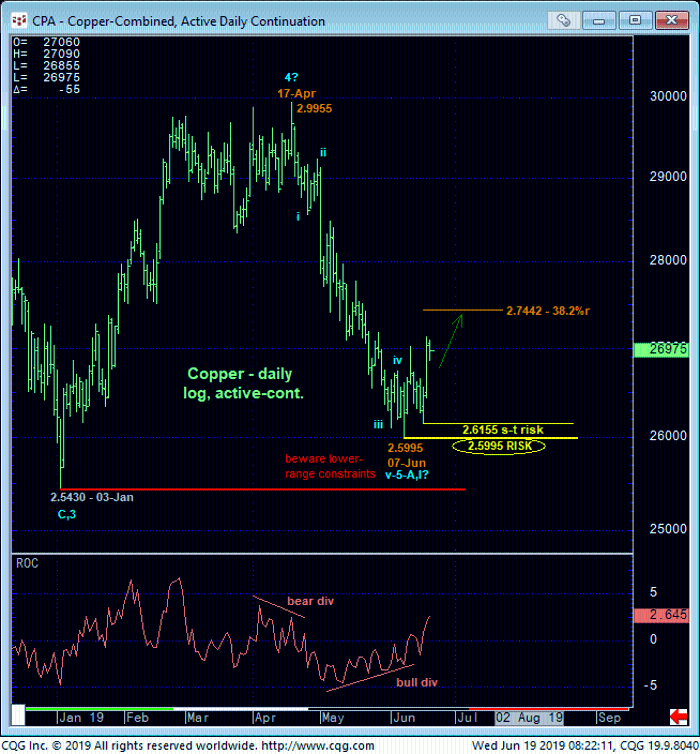
For very long-term reasons we’ll discuss below, this market remains a challenging one due to its position deep within the middle-half bowels of an 8-year lateral range where we believe the odds of aimless whipsaw risk are higher. As for wave counts down from Dec’17’s 3.30 high weekly close shown below, we’d urge taking them with a grain of salt. But the technical facts of late are:
- a confirmed bullish divergence in daily momentum above from
- the extreme lower boundary of the past nine months’ range amidst
- historically bearish sentiment sentiment/contrary opinion levels that have warned of and accompanied past base/correction/reversal environments and
- an exact 50% retrace of Jan’16 – Dec’17’s 1.9435 – 3.3005 rally.
Because of these facts and, most importantly, the market’s rejection/definition of two reliable lows and support that can be used as objective risk parameters to any non-bearish decisions, traders are advised to bias towards at least a steeper correction of Apr-Jun’s 2.9955 – 2.5995 decline and possibly a more extensive reversal. A relapse below at least 2.6155 is required to threaten this call and warrant its cover. What is indeterminable at this juncture is the market’s upside potential following this week’s momentum divergence.
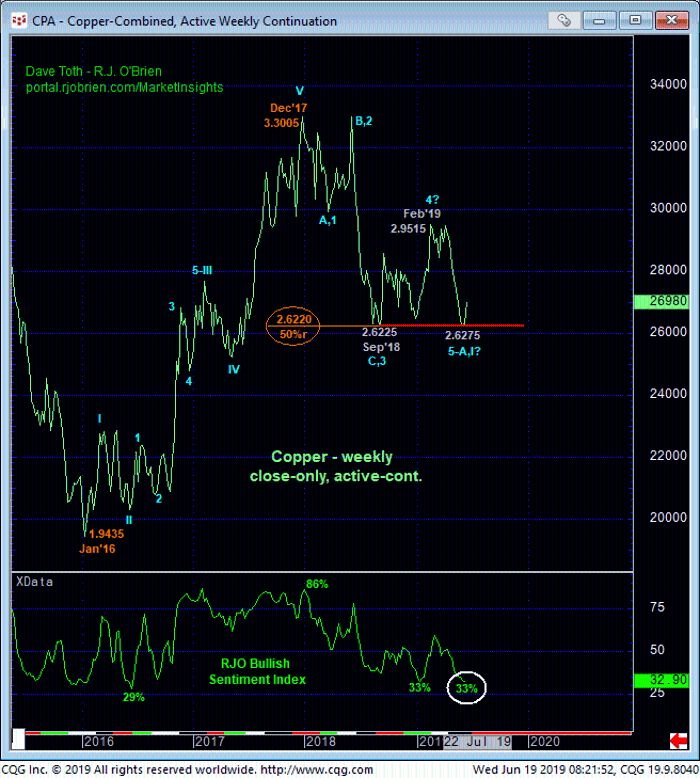
The monthly log chart below shows the market’s position deep in the middle of an 8-year lateral range where aimless whipsaw risk has been proven over the past 10 months and should not surprise by its continuance. Such range-center conditions where the risk/reward merits of initiating directional exposure can be questionable warrant a more conservative approach to risk assumption that places an emphasis on tight but objective risk parameters. But yesterday’s bullish divergence in momentum identifies two such corrective lows and risk parameters at 2.6155 and 2.5995. And until/unless the market relapses below these levels, further lateral-to-higher prices are expected.
These issues considered, traders are advised to move to a neutral-to-cautiously-bullish stance from 2.6750 OB with a failure below 2.6155 required to negate this specific call and warrant its cover.
