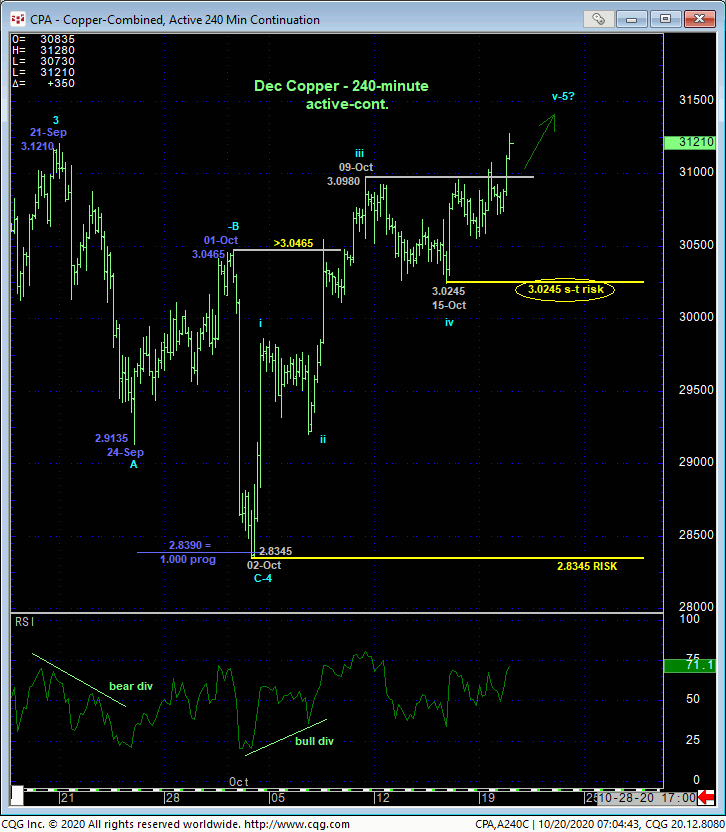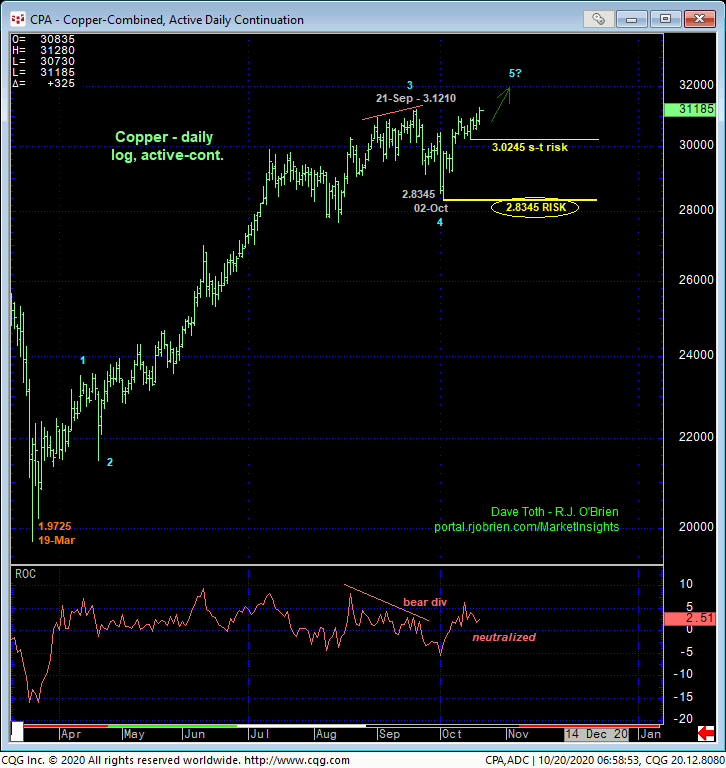
This morning’s break above 21-Sep’s 3.1210 high reinstates this year’s major reversal and uptrend as well as our resurrected bullish count discussed in 07-Oct’s Technical Blog. Today’s strength confirms smaller- and larger-degree corrective low in its wake at 3.0245 and 2.8345, respectively, that now serve as our new short- and long-term risk parameters from which a still-advised bullish policy and exposure can be objectively rebased and managed.
The trend is up on all scales and warrants a bullish policy. But as we’ll discuss below, it’s not hard to find significant threats against the bull, so it’s imperative that the bull continue to PERFORM “up here”. And we will gauge this performance by the market’s ability to sustain gains above at least 3.0245 and certainly 2.8345. Former 3.09-handle-atrea resistance would be expected to hold as new near-term support per any broader bullish count.


Developing threats against the bull include:
- the prospect that this month’s resumed rally from 02-Oct’s 2.8345 low is the completing 5th-Wave of a textbook Elliott sequence up from 19-Mar’s 1.9725 low
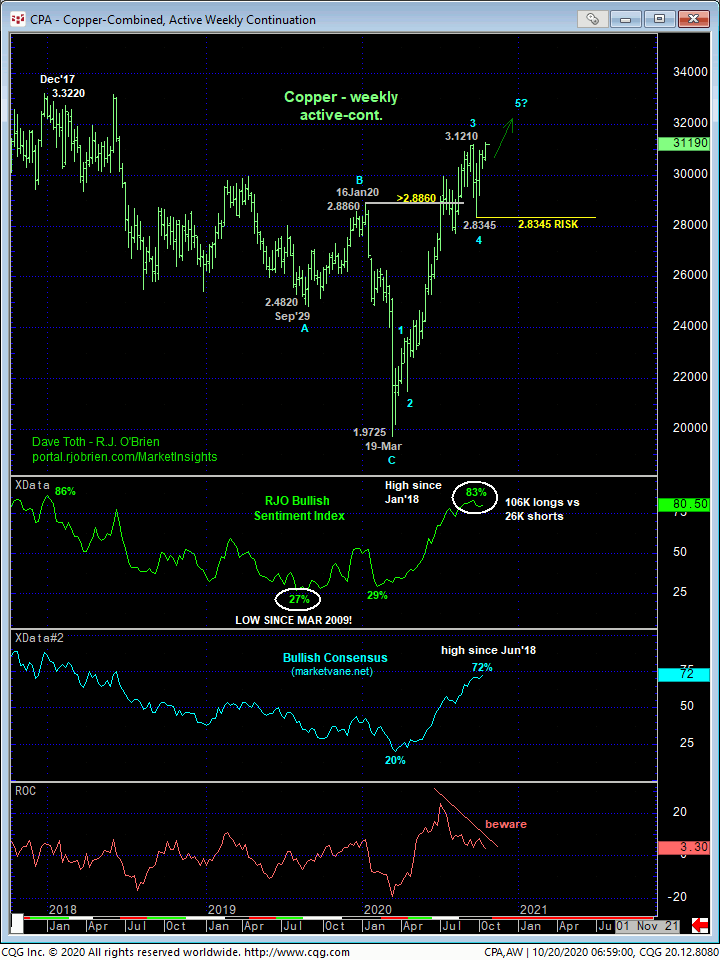
- upside momentum on a weekly basis below that’s been waning for three months
- understandable but historically frothy sentiment/contrary opinion levels not seen since those that warned of and accompanied 3Q18’s major peak/reversal.
These facts and observations define the holy trifecta of technical peak/reversal processes. HOWEVER, NONE of these facts and observations matter one iota until and unless the market breaks the clear and present uptrend. On even a short-term basis, this requires a failure below 3.0245. And even then, that would only allow us to conclude the end of the portion of the uptrend from 02-Oct’s 2.8345 low, NOT the entire Mar-Oct uptrend where commensurately larger-degree weakness below 2.8345 remains required. Until at least such sub-3.0245 weakness is proven, further and possibly accelerated gains should not surprise.

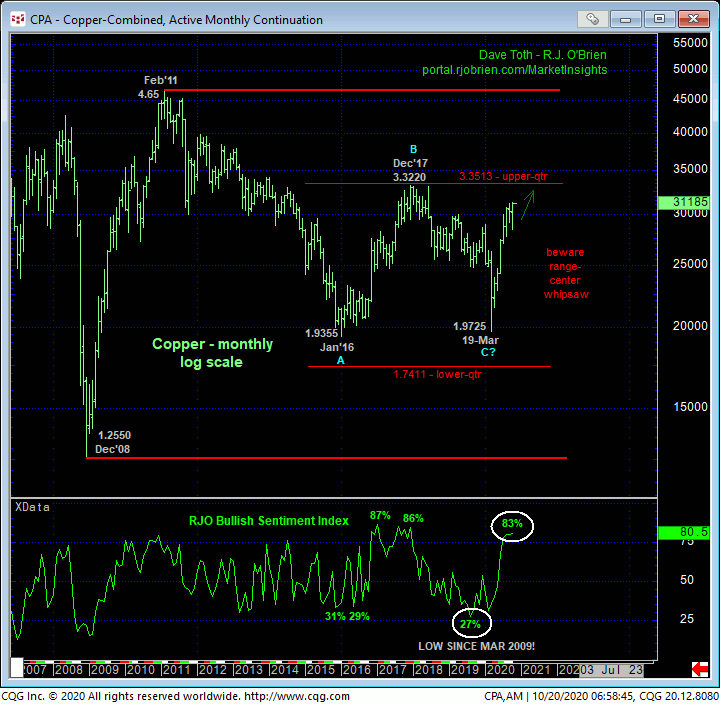
Finally, on a historic basis, the monthly log chart below shows the market’s encroachment on Dec’17’s 3.3220 obviously key high and resistance and the upper-quarter of it’s massive 12-YEAR lateral range. Anther rejection of the 3.30-to-3.35-area would/should hardly come as a surprise. But until and unless this market breaks the clear and present and impressive SEVEN MONTH uptrend, neither should a bust-out into the 3.35+ upper-quarter of this historic range.
In sum, a bullish policy and exposure remain advised with a failure below 3.0245 required for shorter-term traders to move to the sidelines and longer-term players to pare exposure to more conservative levels. In lieu of such weakness, further and possibly accelerated gains are expected with the former 3.09-handle-area resistance considered new near-term support.


