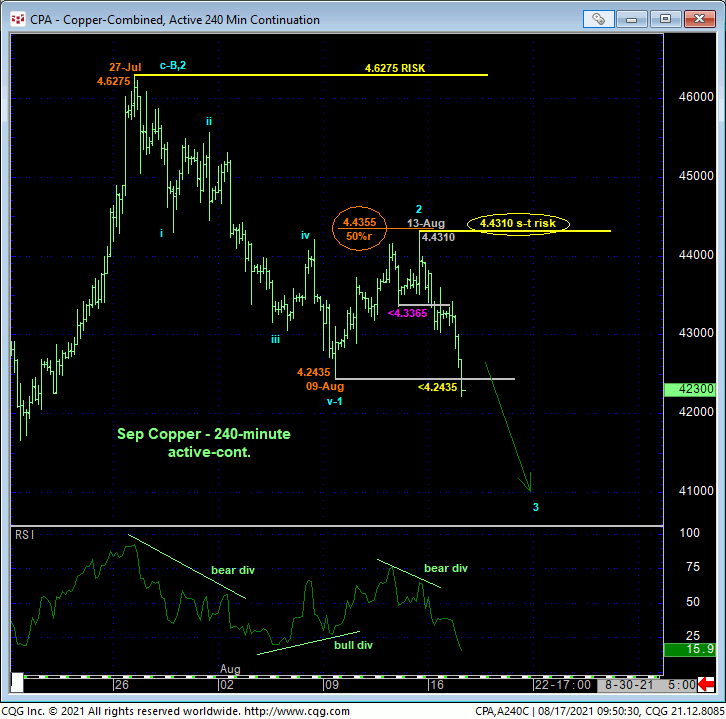
We’ve been discussing the prospects of a major peak/reversal threat since 14-May’s Technical Blog. Three months on, today’s break below last week’s 4.2435 low provides yet another bit of bearish evidence that contributes to this count that could produce protracted losses in the weeks and months ahead. This sub-4.2435 relapse nullifies last Fri’s bullish divergence in short-term momentum and leaves Fri’s 4.4310 high in its wake as the latest smaller-degree corrective high this market is now minimally required to recoup to defer or threaten our broader bearish count. Per such, this 4.4310 level serves as our new short-term risk parameter from which shorter-term traders with tighter risk profiles can objectively rebase and manage the risk of a bearish policy and exposure.


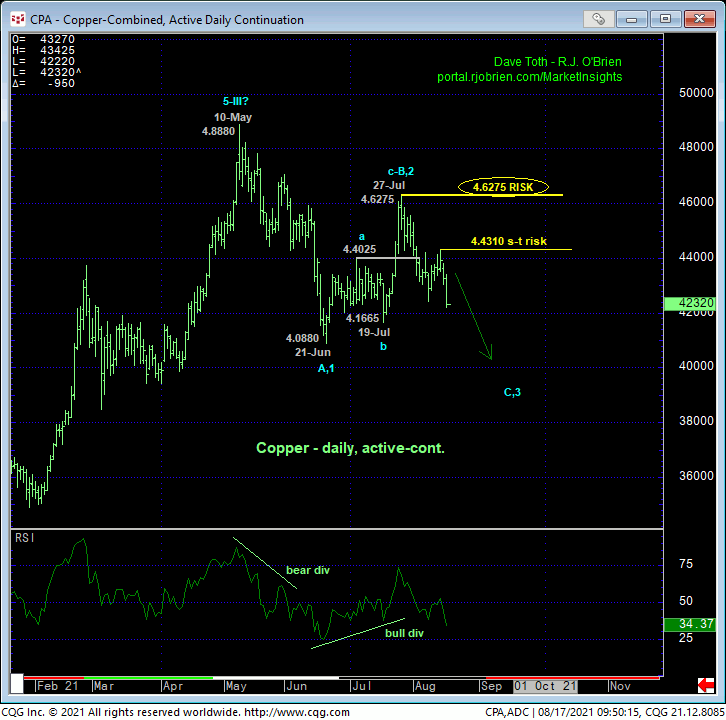
The daily chart above shows today’s resumed slide from 27-Jul’s 4.6275 high and end to what clearly is only a 3-wave recovery from 21-Jun’s 4.0880 low. Left unaltered by a recovery above 4.6275, this 3-wave rebound is considered a (B- or 2nd-Wave) correction ahead of a (C- or 3rd-Wave) resumption of May-Jun’s decline to levels potentially well below 4.0880. In this regard, that 4.6275 high remains intact as our key long-term risk parameter from which longer-term commercial players can objectively base and managed a still-advised bearish policy and exposure.
Longer-term players are also reminded that Jun-Jul’s 3-wave corrective recovery attempt comes on the heels of:
- early-Jun’s bearish divergence in daily momentum
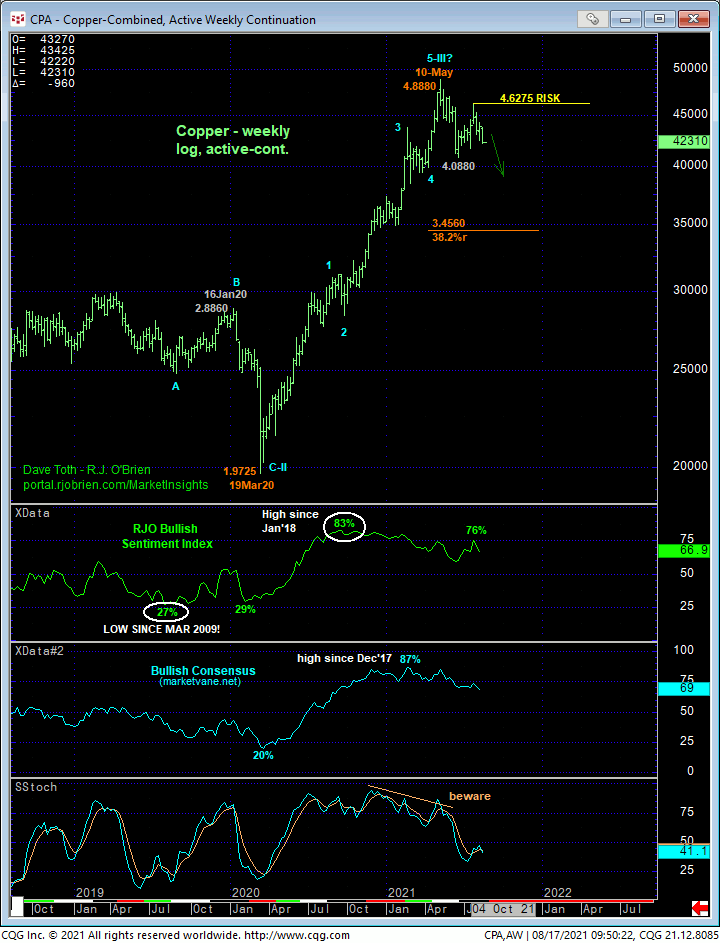
- the nicely developing potential for a bearish divergence in WEEKLY momentum (confirmed below 21-Jun’s 4.0880 initial counter-trend low)
- sentiment/contrary opinion levels that, while understandably are steadily eroding, are doing so from historically frothy levels not seen in at least three years
- an arguably complete (textbook even) 5-wave Elliott sequence from Mar’20’s 1.9725 low to 10-May’s 4.8880 high as labeled below, and….

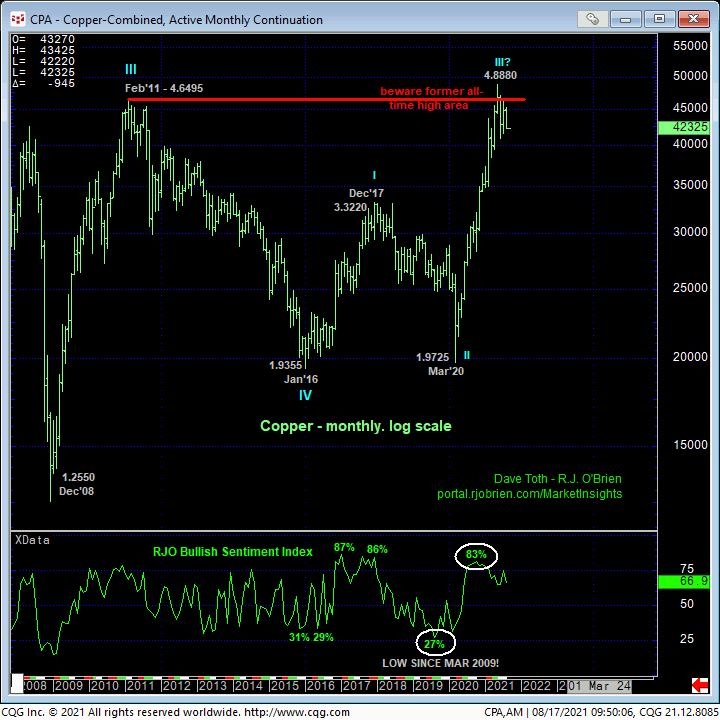
- …the market’s recent proximity to and rejection thus far of Feb 2011’s 4.6495 high shown in the monthly log chart below.
All of these technical facts and observations, at the very least, question the risk/reward merits of any bullish policy “up here”. At best, they’re indicative of a peak/reversal threat that could be major in scope, correcting or reversing a 14-month, 148% rally where even a Fibonacci minimum 38.2% retrace doesn’t cut across until the 3.45-area on a log scale basis.
These issues considered, a bearish policy and exposure remain advised with a recovery above 4.4310 required for shorter-term traders to step aside and commensurately larger-degree strength above 4.6275 for longer-term institutional players to follow suit. Until and unless such strength is proven, further and possibly steep, protracted losses to levels well below 4.0880 are anticipated.


