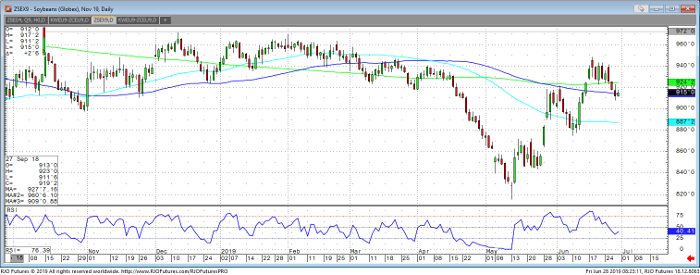
The average estimate for today’s planting intentions report is 84.68 million acres compared to 84.62 million acres in March. Grain stocks estimate is 1.865 billion bushels and compared to 1.219 billion last year. The forecast has improved for the central and southern Midwest, but the extended forecast models are not as hot and turned a bit more wet than previous runs. As of June 23rd, Illinois soybean emergence was 67% compared to a 5-year average of 93%, Indiana was 56% vs 92%, and Ohio at 45% vs 93%, so there is obviously still some issues in the way. Resistance comes in at 919 and support at 904.
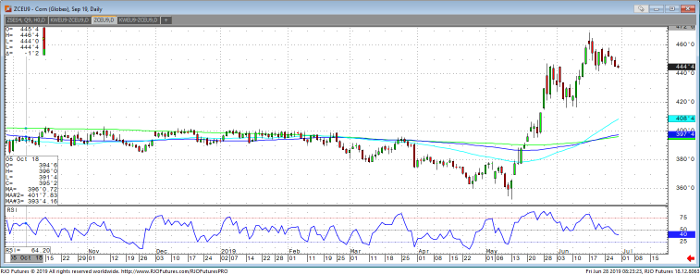
Without a bearish surprise from the USDA today, the potential extreme tightness ahead on any sign of abnormal weather should hold the corn market in an uptrend due to major uncertainties. There will not be any absolute clear picture until August when we get some better guesses on planted acres. The USDA is not typically aggressive at this time of the year because of how much time is left for the crop to improve, but this year seems to be different. The report is at 11am CST. Resistance comes in at 454 and support at 447.
Soybeans Nov ’19 Daily Chart

Corn Sep ’19 Daily Chart


