Posted on Jul 19, 2023, 09:33 by Dave Toth
Since mid-Nov of last year and as introduced in 18Nov22’s Technical Webcast, we’ve been of the technical opinion that Apr’22’s 8.25 high completed the secular bull market from Apr’20’s 3.090 low and has entered a new secular bear market that could span years. Ever since, this market has yet to provide the evidence necessary to threaten or negate this long-term bearish count. And while 21-Jun’s 6.30 larger-degree corrective high remains as our key long-term bear risk parameter this market needs to recoup to threaten our long-term bearish count, for reasons discussed below as a result of the extent of this week’s recovery, we believe the current recovery to a pivotal around the current 5.50-to-5.60-area puts this market at a key crossroads that could have long-term directional implications.
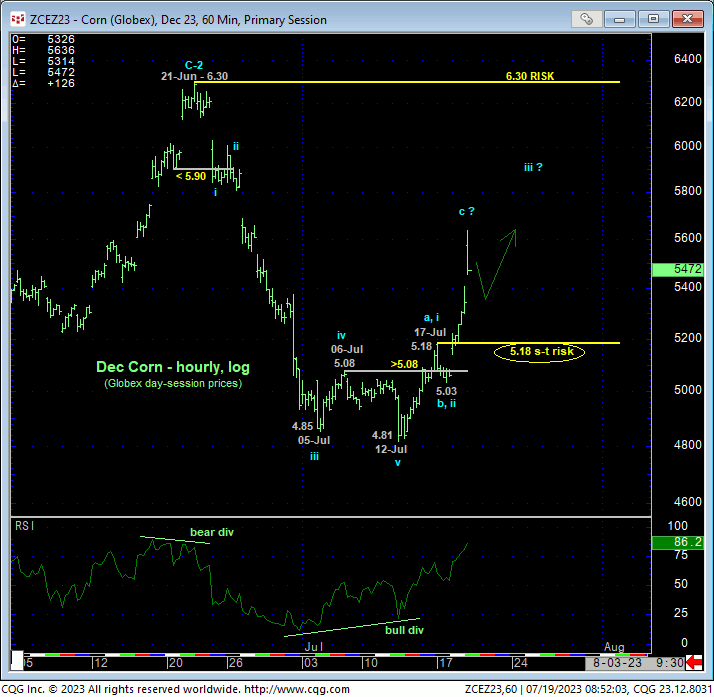
First, from a very short-term perspective, the hourly chart below shows the past couple days’ accelerated recovery following Fri’s bullish divergence in short-term momentum discussed in Mon’s Technical Blog. This recovery from 12-Jul’s 4.81 low can be one of only two things at this point: a relatively steep but corrective event within the still unfolding major bear market or the initial counter-trend and impulsive move of a reversal higher that could produce shocking gains. We have identified Mon’s 5.18 high as the end of the initial component of this recovery. This 5.18 high is either the a-Wave of a bear market correction of the 1st-Wave of an eventual and potentially major 5-wave sequence up. To maintain the impulsive integrity of a broader bullish count, this market should not be able to relapse below 5.18. Such a relapse would render the recovery from 4.81 a 3-wave and thus corrective affair that would re-expose the major bear trend. Per such, we’re defining 5.18 as our new short-term but key parameter from which the risk of non-bearish decisions like short-covers and bullish punts can now be objectively based and managed.


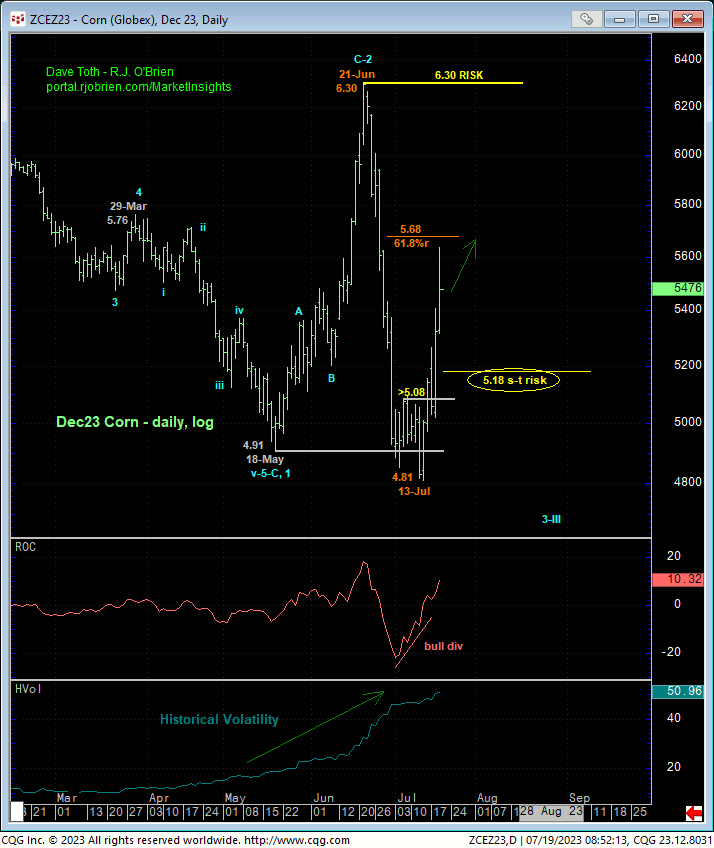
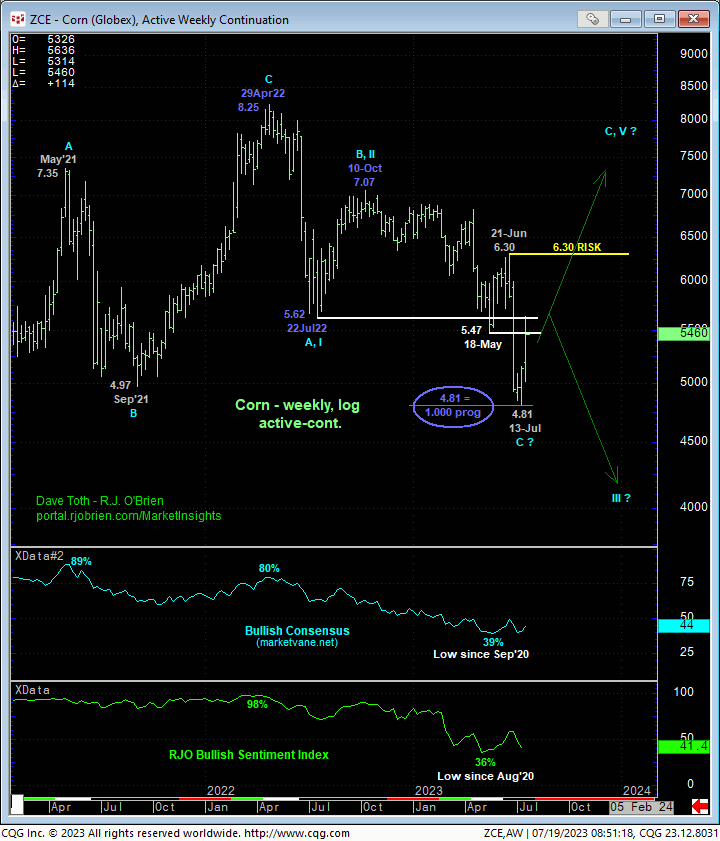
On a broader basis, the daily chart of the Dec contract above shows Fri’s bullish divergence in momentum that broke Jun-Jul’s downtrend and exposed a countering correction or reversal higher. This chart also shows the tremendous spike in historical volatility that hasn’t been seen since Jun/Jul’22 but is not unusual at this time of the (growing season) year. On both this daily basis and on a weekly log active-continuation basis below, it is clear that 21-Jun’s 6.30 larger-degree corrective high is THE long-term threshold that this market remains MINIMALLY required to recoup to, in fact, break even the downtrend from last Oct’s 7.07 high, let alone threaten the 15-month decline from Apr’22’s 8.25 high. It is for this reason that we maintain 6.30 as our key long-term bear risk parameter pertinent to longer-term commercial players.
HOWEVER, it is VERY interesting to note that 13-Jul’s 4.81 low is the EXACT 1.000 progression of Apr-Jul’22’s 8.25 – 5.62 initial counter-trend decline taken from 10-Oct’s 7.07 corrective high in an entire structure down from 8.25 that thus far is clearly only a 3-wave structure. Left unaltered by a relapse below 4.81 and reinforced by a recovery above 6.30, this 15-month, 3-wave decline cannot be ignored as a major BULL market correction ahead of an eventual resumption of the secular bull to new highs above 8.25.
WOW!
BUT IF such a long-term bullish count is what this market has in mind, the bull’s first hurdle prior to the obviously key 6.30 high is the general 5.50-to-5.65-area that provided key support from Jul’22 to May’23 before the bear demolished this area in late-Jun. This key former support area would be expected to “hold” as new key resistance IF our still-preferred long-term bearish count is intact and the past week’s recovery is a correction. Herein lies the importance of our short-term bull risk parameter at 5.18 discussed above, a failure below which will not only diffuse a more immediate bullish count, but also be considered consistent with our long-term bearish count.

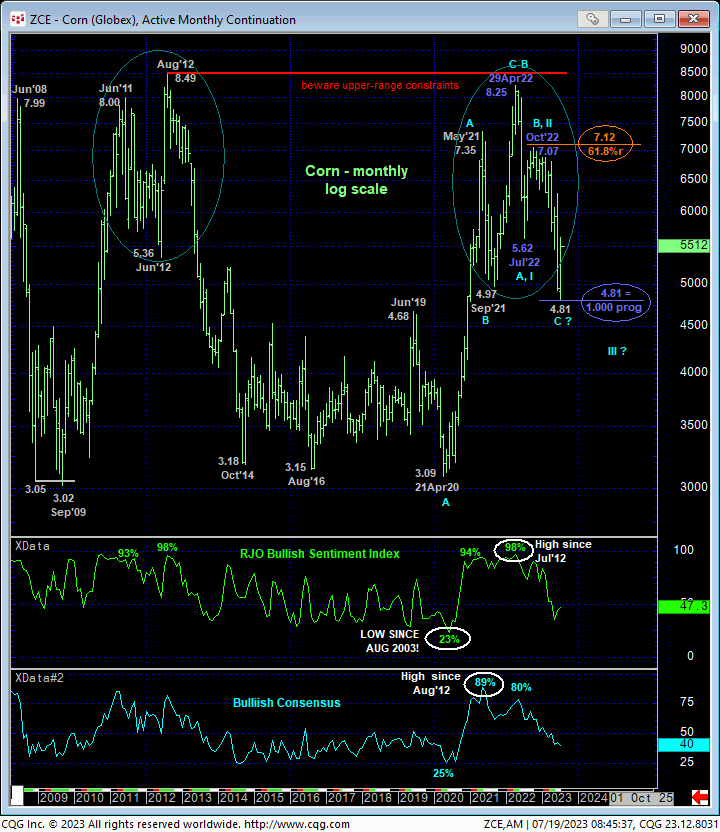
Finally, the even longer-term monthly log active-continuation chart below shows the similarities of the past couple years’ peak/reversal process to that that unfolded between 2011 and 2012 that warned of a major top and new secular bear market that ended up spanning eight years and a 63% drop in corn prices. To even threaten, let alone negate our current long-term bearish count, this market must recoup 21-Jun’s 6.30 high. But a clear break above the 5.50-to-5.65-area and key resistance candidate would be hard to ignore as an interim indication of developing strength and deferral or threat to a broader bearish count.
These issues considered, a neutral-to-cautiously-bullish stance remains advised for shorter-term traders with a failure below 5.18 required to negate this call, re-expose the long-term bear and warrant a return to a cautious bearish stance. A bearish policy remains advised for long-term commercial players with a clear break and close above 5.65 required to defer or threaten this call enough to warrant paring bearish exposure to more conservative levels, with subsequent and commensurately larger-degree strength above 6.30 to nullify a bearish policy altogether. We will be watchful for a recovery-countering bearish divergence in short-term momentum in the period immediately ahead that may provide a tighter and more practical level from which to objectively base non-bullish decisions like long-covers and resumed bearish exposure.


