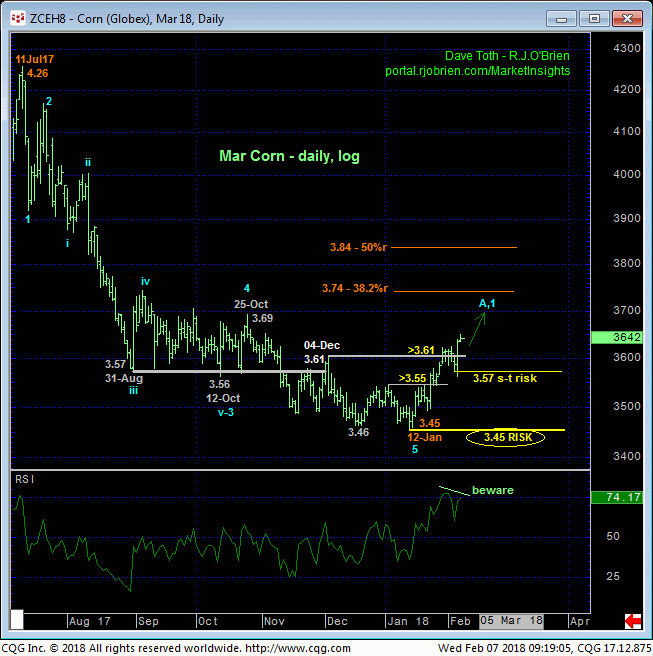
Yesterday and today’s clear break above 30-Jan’s 3.62 high is consistent with our major base/reversal count introduced in 19-Jan’s Trading Strategies Blog. An important by-product of this resumed strength is the market’s definition of Mon’s 3.57 low as the latest smaller-degree corrective low this market is now minimally required to fail below to stem the uptrend and expose what we’d then believe is a (B- or 2nd-Wave) correction of the rally from 12-Jan’s 3.45 low within a broader base/reversal process. In this regard that 3.57 low becomes our new short-term risk parameter from which a recommended bullish policy and exposure can be objectively rebased and managed by shorter-term traders with tighter risk profiles.

This tight but objective risk parameter at 3.57 may come in handy if the market is nearing the end of the initial A- or 1st-Wave up. We always speak of our three reversal requirements:
- a confirmed bullish divergence in momentum
- proof of trendy, impulsive, 5-wave price action in the direction of the suspected new trend and, most importantly,
- proof of labored, corrective, 3-wave behavior on a subsequent relapse attempt.
The first two of these requirements have been satisfied. And while the length/scope of an initial counter-trend move is always an unknown and could be extensive, especially under current bearish sentiment conditions, traders are reminded of what is TYPICAL within such base/reversal PROCESSES: a corrective rebuttal to the initial counter-trend move that often times is “extensive” (i.e. 61.8% retrace or more).
A failure below 3.57 will likely expose such a relapse. Until such sub-3.57 weakness is proven however, the trend is clearly up and should not surprise by its continuance or acceleration with former 3.62-area resistance considered new near-term support.

Reiterating, the key technical facts to a base/reversal count that could be major in scope are:
- a confirmed bullish divergence in momentum that defines 12-Jan’s 3.45 low as the
- completion of a 5-wave Elliott sequence down from 11-Jul-17’s 4.26 high amidst
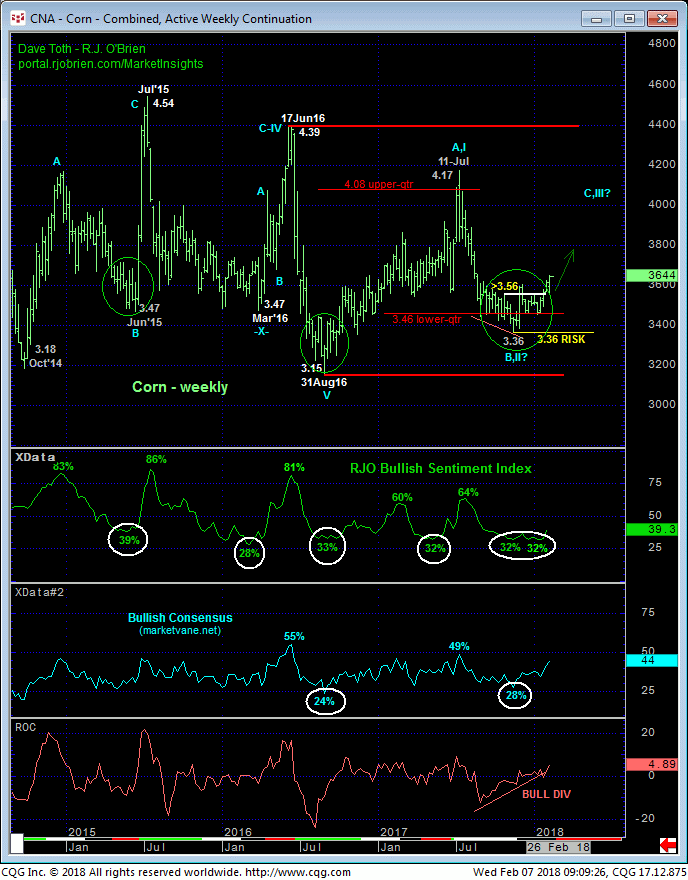
- historically bearish levels of market sentiment shown in the weekly log active-continuation chart below.
This is the holy trilogy of technical reversals, requiring a failure below our long-term risk parameter at 3.45 to negate. In lieu of such sub-3.45 weakness we anticipate at least a major correction of Jul-Jan’s 4.26 – 3.45 decline and possibly a major reversal to 4.00+ levels.


As often discussed, the past three years’ merely lateral price action and associated sentiment levels are similar to those that followed Dec’08’s 3.05 low and ultimately led to a major move higher. We also believe that the past three years’ price action from Oct’14’s 3.18 low will prove similar to the huge base/reversal environment that stemmed from Sep 1998’s 1.96 low. And while the major bull didn’t really take hold until 3Q06- EIGHT YEARS after the start of the reversal process- the market was vulnerable to some extensive spikes following Aug 2000’s 1.85 low.
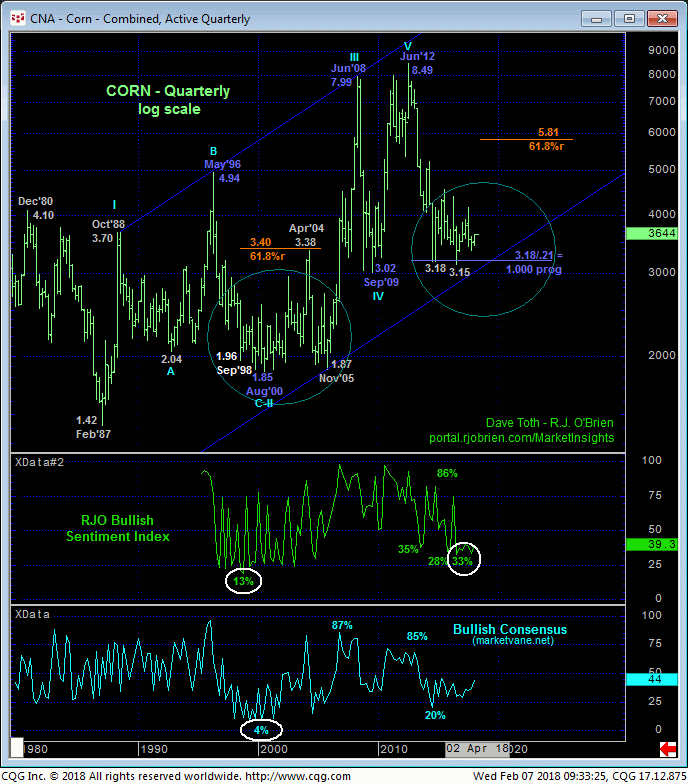
One of these spikes retraced 61.8% of the entire preceding secular bear market from May’96’s 4.94 high to Aug’00’s 1.85 low. A current 61.8% retrace of 2012-2016’s 8.49 – 3.15 secular bear cuts across at 5.81. Are we forecasting a move to 5.81? Absolutely not. But until and unless this market fails below 3.15, we believe this market will see 4.50, 5.00, 5.50 or higher before sub-3.15 levels. For long-term players we believe the risk/reward merits of a bullish policy “way down here” are extraordinary.
Finally and most compellingly, we still find it amazing that the 2012-2016 secular bear market spanned an identical length to BOTH of the preceding bear markets (2008-09 and 1996-2000) on a quarterly log scale basis below. This Fibonacci fact (which, even more amazingly, has also unfolded in the soybean market) is icing on the cake of the technical facts listed above that warn of a major reversal higher.
These issues considered, a bullish policy and exposure remain advised with a failure below 3.57 required for shorter-term traders to move to the sidelines and commensurately larger-degree weakness below 3.45 for long-term players to take similar defensive action. In lieu of such weakness we anticipate further and possibly accelerated gains straight away with indeterminable upside potential.


