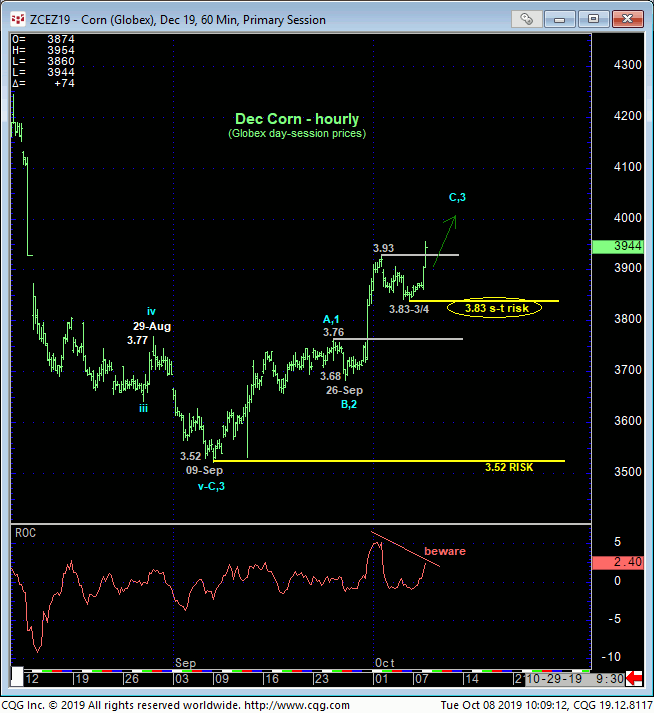
DEC CORN
Today’s break above last week’s 3.93 high reaffirms our bullish count introduced in 11-Sep’s Trading Strategies Blog and leaves Fri’s 3.83-3/4 low in its wake as the latest smaller-degree corrective low this market is now minimally required to fail below to confirm a bearish divergence in momentum, stem the clear and present uptrend and expose at least an interim correction lower. In lieu of a failure below 3.83 that we’re considering as our new short-term risk parameter, further and possibly accelerated gains remain expected straight away.
Our long-term base/reversal count remains predicated on:
- the market’s continued rejection of the lower-quarter of the 3.15-to 4.55-range that has quarantined it for the past FIVE YEARS amongst
- historically bearish sentiment/contrary opinion levels on each failed attempt to break the
- 3.60-to-3.40-range that has held as an obvious support area for the past two years.
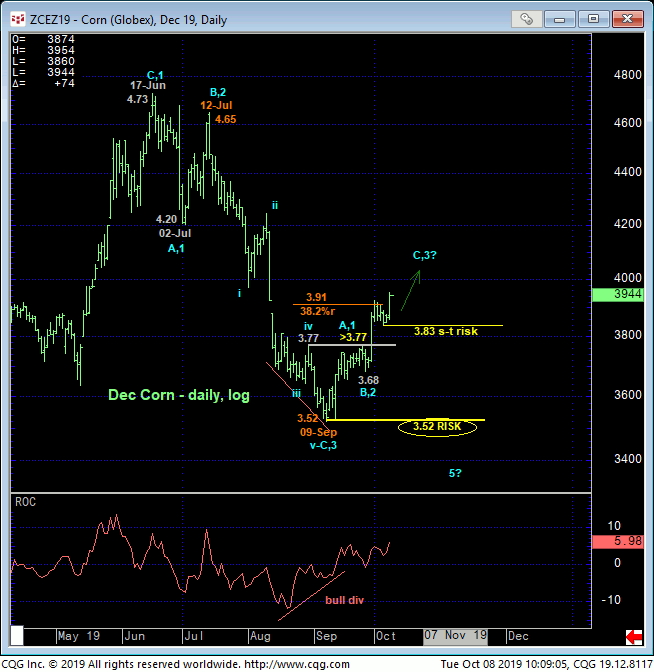
30-Sep’s ultimate bullish divergence in momentum above 29-Aug’s 3.77 corrective high and 25-Sep’s 3.77 initial counter-trend high, in fact, breaks Jun-Sep’s downtrend and confirms the new larger-degree trend as up. JUST LIKE 14-May’s bullish divergence in momentum that broke the downtrend from Dec’18’s high and reinforced our long-term bullish count, we do not know if this current rally will be THE RALLY that breaks out above the upper boundary of the lateral 5-year range around the 4.50-to-4.70-area.
What we DO know now, as back in May, is that the market has identified some very specific lows and risk parameters from which a bullish policy and exposure can be objectively based and managed: 3.83 (very tight) and 09-Se’s 3.52 obviously key low. Until these levels are broken, especially the 3.52 low, the technical facts listed above warn of higher prices and possibly accelerated gains. And the further the market rallies away from these risk parameters, the poorer and less efficient the risk/reward merits will be of chasing bullish decisions at higher levels.
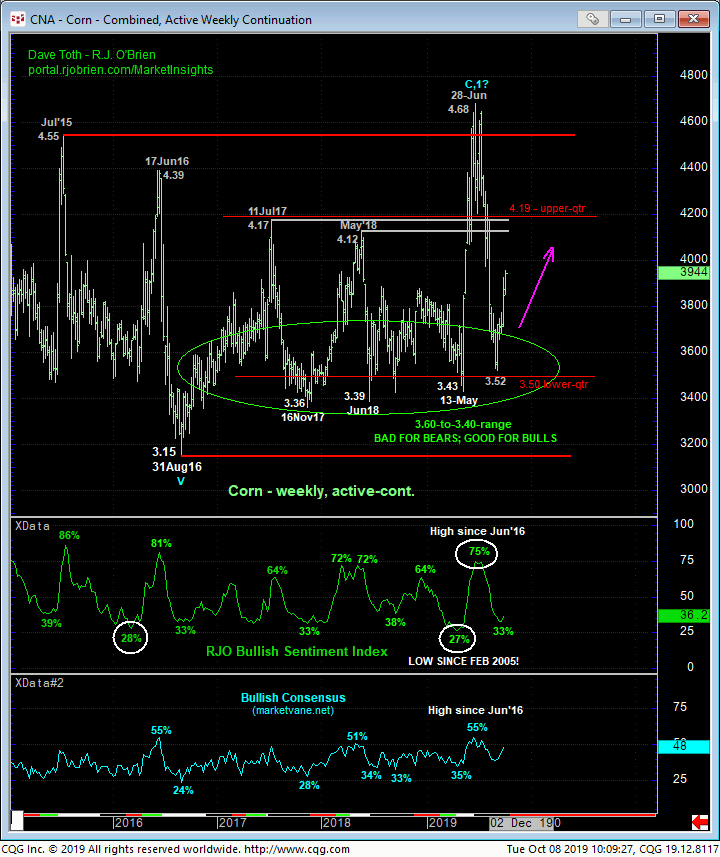
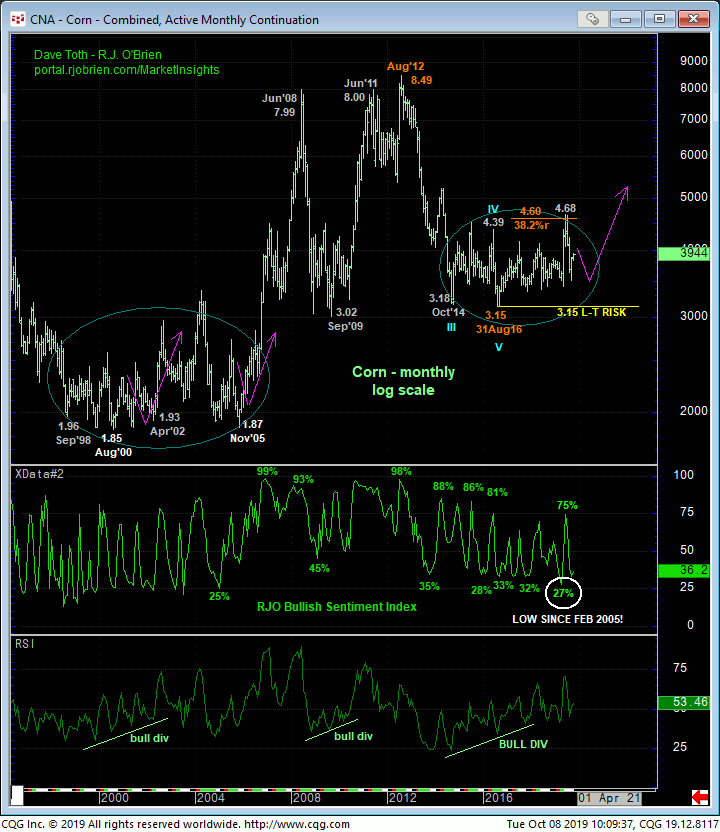
Finally, we’ve referred to this monthly log chart below numerous times since Oct’16’s rally above roughly 3.50 first warned that 31Aug16’s 3.15 low might have completed the 5-wave secular bear market from Aug’12’s 8.49 all-time high. The start of that slowdown process that preceded Aug’16’s 3.15 low dates from Oct’14’s 3.18 low and has continued with 4Q17, Jun’18 and 2Q19 corrective retests of that 3.15 low that shows a virtually identical base/reversal process that stemmed from Sep 1998’s 1.96 ow before the secular bull finally took off in 2006. Per this comparison and, more importantly, the market’s continued INability to behave like a bear once it hits that supportive floor around 3.60-to-3.40, we believe this market will trade 5.00 before it trades 3.14.
What CROP YEAR such a major reversal takes place is another challenge altogether. But for now and given the technical facts of the past few weeks, the market has provided all the evidence necessary to warrant a bullish policy and exposure with a failure below 3.83 required for shorter-term traders to pare or neutralize exposure and commensurately larger-degree weakness below 3.52 required for long-term players to move to a neutral/sideline position. In lieu of such weakness, we anticipate further and possibly accelerated gains straight away.
NOV SOYBEANS
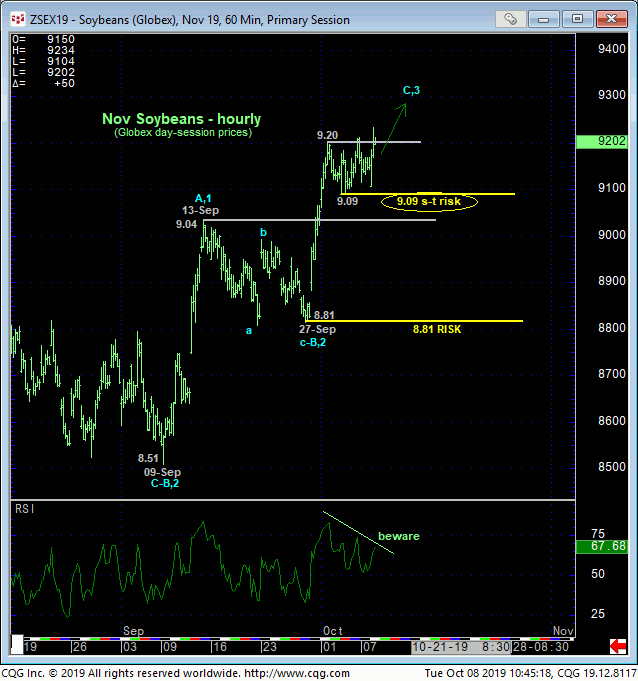
Similarly, today’s poke above recent 9.20-area highs and resistance reaffirms the developing uptrend and leaves 03-Oct’s 9.09 low in its wake as the latest smaller-degree corrective low and new short-term risk parameter from which shorter-term traders can objective rebase and manage the risk of a still-advised bullish policy. Commensurately larger-degree weakness below 27-sep’s 8.81 next larger-degree corrective low and key risk parameter remains required to threaten a broader bullish count and throw the market back into Jun-Sep’s 9.48 – 8.51 consolidation range. These shorter- and longer-term bull risk parameters may come in handy as the market nears the upper-quarter of the past four months’ range.
Until such weakness is verified however, traders are reminded of the 5-wave impulsiveness of May-Jun’s 8.15 – 9.48 rally and 3-wave corrective relapse from 9.48 to8.51 that form the building blocks to a much broader base/reversal environment and an eventual breakout above the 9.37-to-9.48-area that ha capped this market since late-2018.
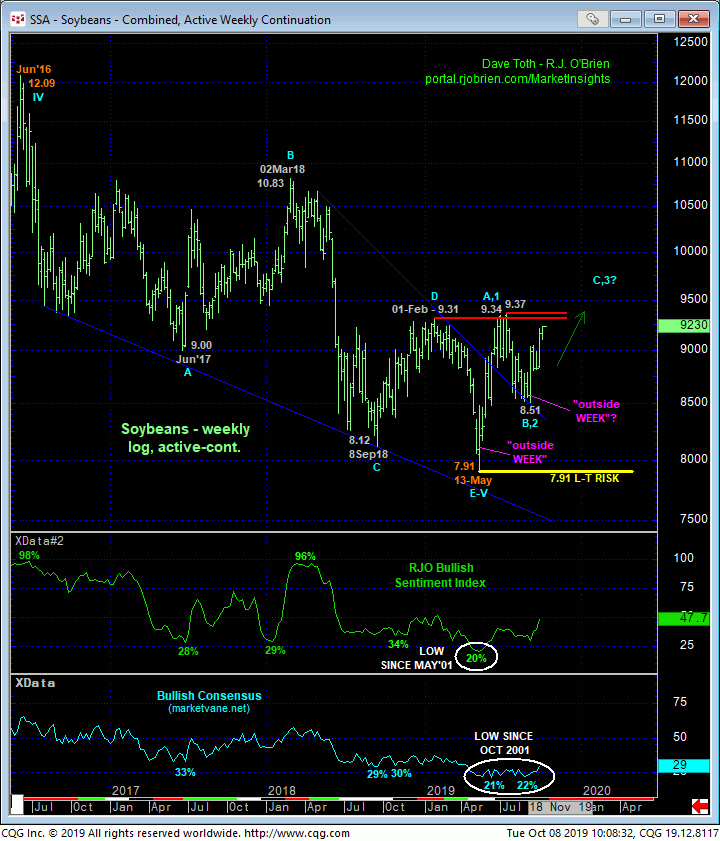
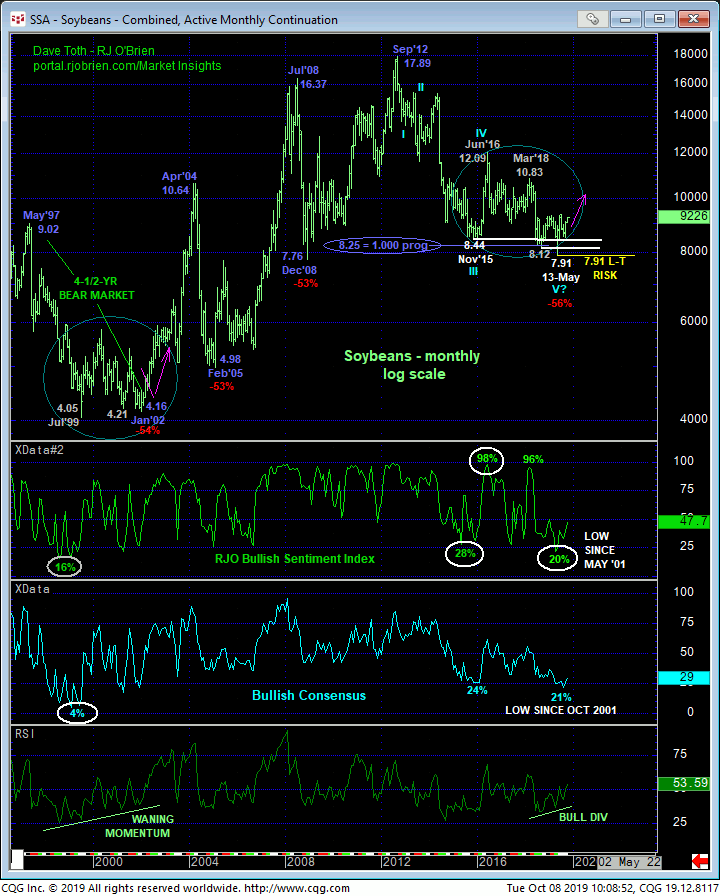
The weekly log chart above show this range cap around 9.40. But this chart and the monthly log chart below also show:
- a confirmed bullish divergence in MONTHLY momentum
- an arguably complete 5-wave Elliott sequence down from Sep’12’s 17.89 al-time high
- “outside WEEKS up” THE WEEK of 13-May’s 7.91 low and 09-Sep’s 8.51 corrective retest low
- a secular (56%) decline that’s virtually identical (i.e. 1.000 progression) to all three previous major sell-offs
- the market’s gross failure to sustain May’s violation of an 8.44-to-8.12 support area that dated from Nov’15 and, most indicting
- historically bearish sentiment/contrary opinion levels this year that haven’t been seen since 2001!
This contrary opinion fact bears (no pun intended) repeating. During May’s collapse to new lows for a 7-year bear market and the lowest prices since Dec’08, the sentiment/contrary opinion condition of this market reached its lowest level in 18-YEARS. While the market was getting its brains bashed in, such bearish sentiment was fully expected, understood and required. The moment the market failed to sustain the bear trend was the moment this contrary opinion extreme support not only a bullish count, but one that can be massive in scope, reversing a 7-year secular bear.
It’s easy to see the similarities of the past four years’ price action circled in blue below to the major base/reversal process that ended/reversed the 197 – 2002 bear market. It’s also easy to see the bull’s performances after previous and similar 53%, 53% and 54% declines in 2008, 2005 and 2002.
These issues considered, a bullish policy remains advise with admittedly very short-term weakness below 9.09 sufficient for shorter-term traders to pare or neutralize bullish exposure and subsequent and commensurately larger-degree weakness below 8.81 for long-term payers to step aside. Until and unless such weakness is prven however, we anticipate further and possibly accelerated gains ahead and to eventual new highs above 9.50.