DEC CORN
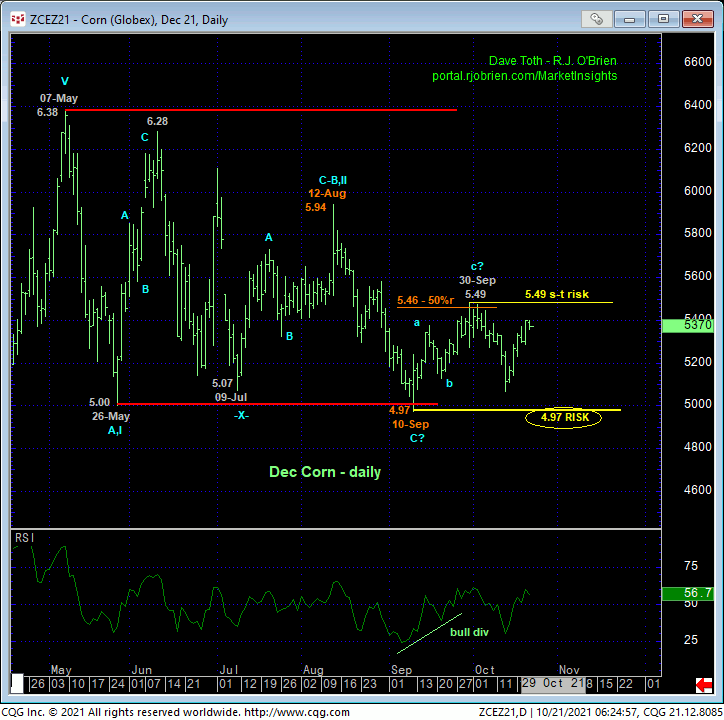
For months now, ever since 17-Mayt’s bearish divergence in WEEKLY momentum, we’ve been approaching this market from a major peak/correction/reversal perspective. This major momentum failure, combined with historically frothy bullish sentiment and a complete 5-wave Elliott sequence from Apr’20’s low reinforced this major “non-bullish” condition. Five months on however, only a glance at the daily chart of Dec corn below is needed to see that the price action down from the May high is about as labored and consolidative as it gets. And when the market broke the “pivotal” 5.07-to-5.00-area support on 10-Sep and the bear had every opportunity to PERFORM in a major 3rd-wave down, it didn’t, with 15-Sep’s bullish divergence in momentum discussed in that day’s Technical Blog rejecting/defining 10-Sep’s 4.97 low as one of developing importance that remains intact as our key longer-term BULL risk parameter.
12-Oct’s bearish divergence in short-term momentum discussed in that day’s Technical Blog left 30-Sep’s 5.49 high in its wake as the end of what clearly is only a 3-wave recovery attempt from 4.97 as labeled below. Left unaltered by a recovery above 5.49, this 3-wave recovery attempt is easily considered a corrective blip that warns of a resumption of Aug-Sep’s downtrend that preceded it to new lows below 4.97.
So something’s gotta give, with traders acknowledging and toggling directional biases around this key range defined by 4.97 and 5.49 commensurate with their personal risk profiles. The inevitable break of either of these levels could expose a major move in the direction of the breakout. But as we’ll discuss below, we urge traders to approach breakouts above or below ANY so-called key flexion point with trepidation, flexibility and especially defined, objective risk parameters due to what we believe is a 2011/2012-type environment that could produce massive whipsaws both ways before the secular bull has one final 5th-wave blast higher into 2022’s crop year. Herein lies the importance of identifying specific risk levels like 4.97 and 5.49 around which to base directional biases and exposure.
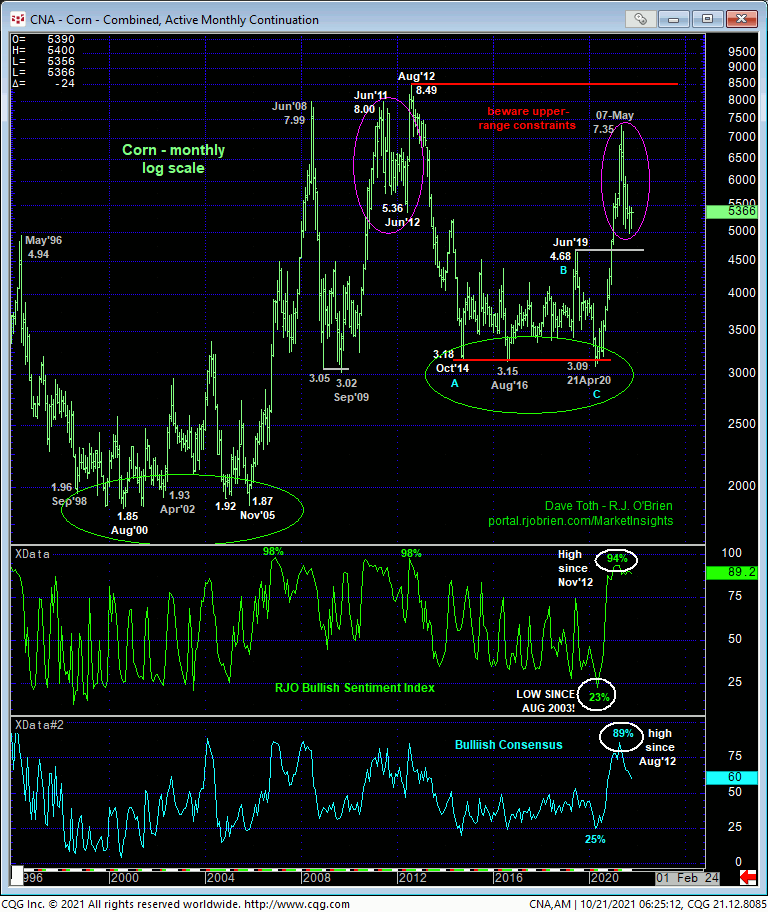
Jumping out to a monthly log chart below, it’s easy to see the peak/correction/reversal-threat elements that stemmed from 17-May’s bearish divergence in momentum that, in fact, broke the 2020 – 2021 uptrend. This leaves the technical and trading challenge of discerning the price action down from May’s 7.35 high as either that of a major reversal lower like the topping process that ended 2008’s price explosion OR that of a major bull market correction that, in the 2011/2012 major topping process took an entire YEAR from Jun’11 until Jun’12 before the final 5th-Wave blast took off.
Given now 5-months of just languishing price action down from the May high, as opposed to sustained, trendy, impulsive price action lower that we’d expect from a reversal, odds may be shifting to the a count that contends the relapse attempt from May’s 7.35 high may be a (4th-Wave) correction ahead of an eventual 5th-Wave explosion next year. Corrections being challenging, difficult, whipsaw beasts however, traders are advised to prepare for a potentially very challenging, whipsaw environment that could last until 2Q22 or 3Q22.
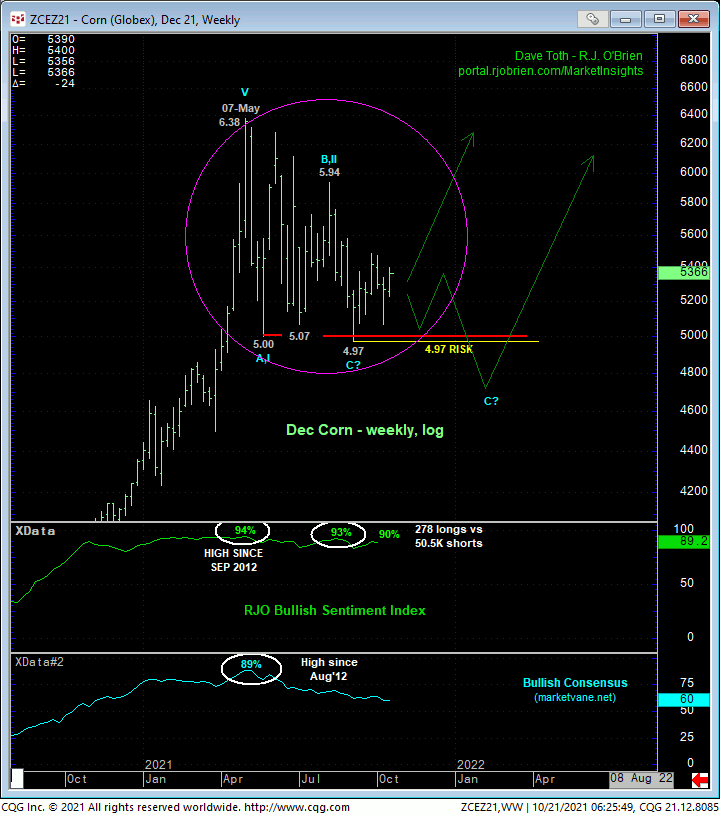
The weekly log scale chart above is that of the Dec21 contract. Again, the price action down from 07-May’s 6.38 high has been extraordinarily labored, suggesting a corrective/consolidative environment that, if correct, warns of an eventual resumption of the secular bull trend that preceded it. A clear AND SUSTAINED impulsive break below 4.97 is required to tilt long-term directional odds of a major reversal lower. If/when the market relapses below 4.97, it will be required to BEHAVE LIKE A BEAR with easily discernible, even obvious trendy, impulsive behavior lower. Its failure to behave accordingly will then tilt the long-term directional scales back to the secular bull market correction count.
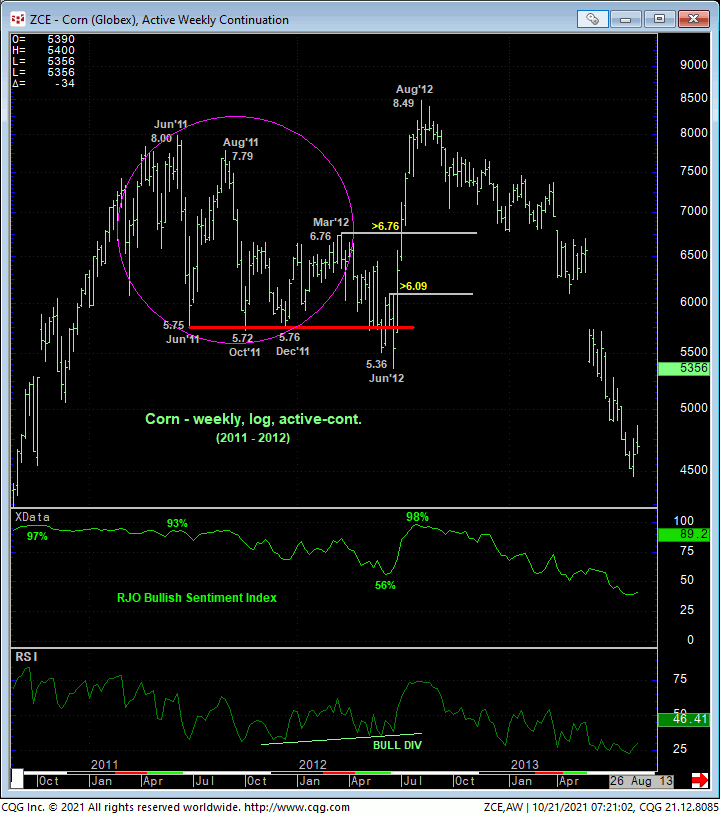
The log scale chart below is a weekly active-continuation look at corn between 2011 and 2012. The price action down from Jun’11’s 8.00 high is IDENTICAL to how this market has tried to sell off this year. Worthy of note is the second-half of 2011’s identified huge support around the 5.75-area, insanely choppy, whipsaw behavior throughout 4Q11 and 1Q12 and the eventual resumption of what became a YEAR-LONG downtrend below 5.75 that THE BEAR FAILIED TO SUSTAIN. This gross non-performance by the bear began with late-Jun’12’s bullish divergence in daily momentum above 6.09 and subsequently with a massive bullish divergence in WEEKLY momentum above Mar12’s 6.76 corrective high that confirmed the entire Jun’11-to-Jun’12 sell-off attempt from 8.00 to 5.36 as a major (4th-Wave) correction and re-exposed the secular bull to new (5th-Wave) highs to 8.49.
These issues considered, traders are urged to be aware of and prepare for a potentially choppy, whippy, challenging environment that could last until summer 2022 with UNsustained “breakouts” both ways. At the outset, we identified recent levels at 5.49 and 4.97 as key flexion points. WHEN, not if, these levels broken, there’s no telling how friendly that trend will be, but we cannot ignore or fade it. A break above 5.49 may put the market on a 5th-Wave tangent to 7.00+. Or the bull could fail miserably and resume the 5-month slide to new lows below 4.97. A sub-4.97 failure, resuming a 5-month downtrend, cannot be ignored or faded as a major, sustained reversal lower, ESPECIALLY with still-stratospheric bullish sentiment/contrary opinion levels. But once below 4.97, it will not be hard to identify prior corrective highs and risk parameters the bear should then easily sustain losses below if a broader reversal is at hand.
In the days and weeks immediately ahead, traders are advised to toggle directional biases and exposure around 5.49 and 4.97 commensurate with their personal risk profiles. End-users should want to be at least a little bit bull-hedged while 4.97 holds and then add to this protection on a break above 5.49. Producers are OK to be cautiously bear-hedged while the market stays below 5.49 and then add to this protection on a break below 4.97. A recovery above 5.49 mitigates the need for a bear hedge until and unless the market fails to sustain such 5.49+ strength.
NOV SOYBEANS
For brevity’s sake, suffice it to say that the long-term technical elements and expectations for beans are identical to those detailed above in corn. The only difference thus far is that the bean market has yet to break the 4-month downtrend from 07-Jun’s 14.80 high shown in the daily log chart below. As recently discussed, a recovery above at least our short-term risk parameter and area of former support-turned-resistance at 12.59 remains required to threaten the downtrend from 01-Jul’s 14.23 high. Commensurately larger-degree strength above 27-Sep’s 12.97 larger-degree corrective high and key long-term risk parameter remains required to expose the entire sell-off attempt from Jun’s 14.80 high as a 3-wave and thus corrective affair that would see it join the corn market in the scenario we detailed above.
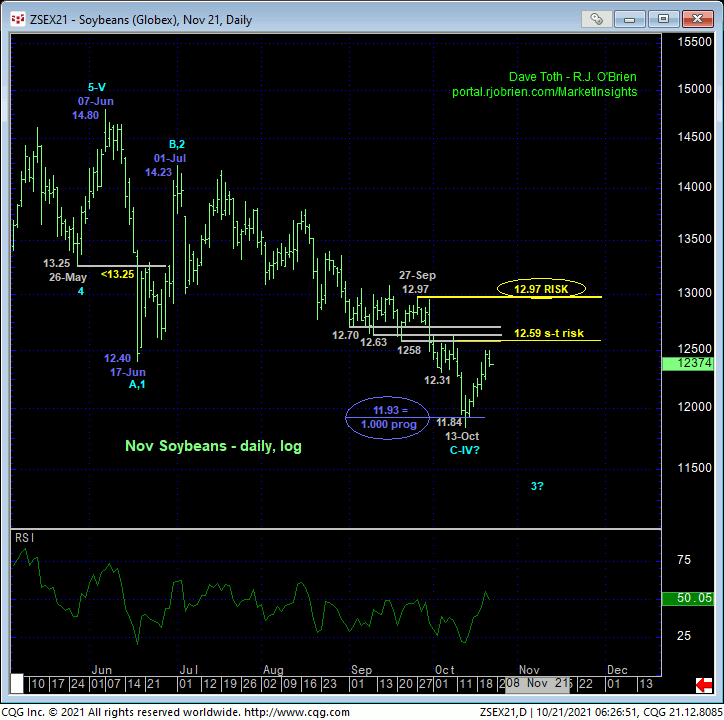
Similar to corn, we have to acknowledge the prospect that the past four months’ relapse is just a major 4th-Wave correction similar to 2011’s correction ahead of an eventual and final 5th-Wave resumption of the secular bull to new highs above 16.68. IF this is the case, then somewhere along the line this market has got to arrest the 4-month downtrend with a bullish divergence in momentum. We’ve identified specific bear risk parameters at 12.59 and 12.97 to suggest and then conclude such an arrest. In lieu of such strength, further losses should not surprise.
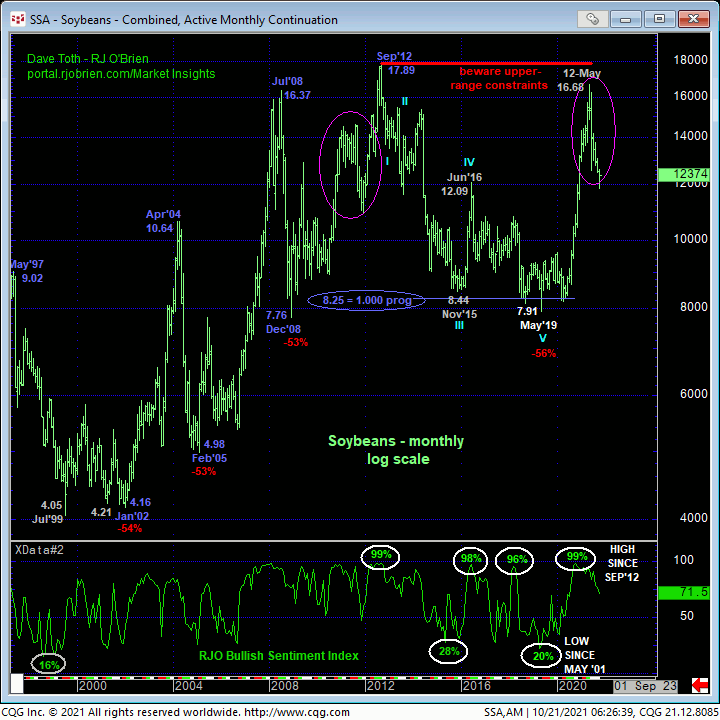

Perhaps interestingly, the weekly log scale chart of the Nov21 contract above shows the 4-month sell-off thus far holding at the exact (11.85) 38.2% retrace of its entire Apr’20 – Jun’21 rally from 8.26 to 14.72. As always, such a merely “derived” technical level means nothing without an accompanying confirmed bullish divergence in momentum, and herein lies the importance of recent corrective highs and risk parameters, even a short-term one like 12.59.
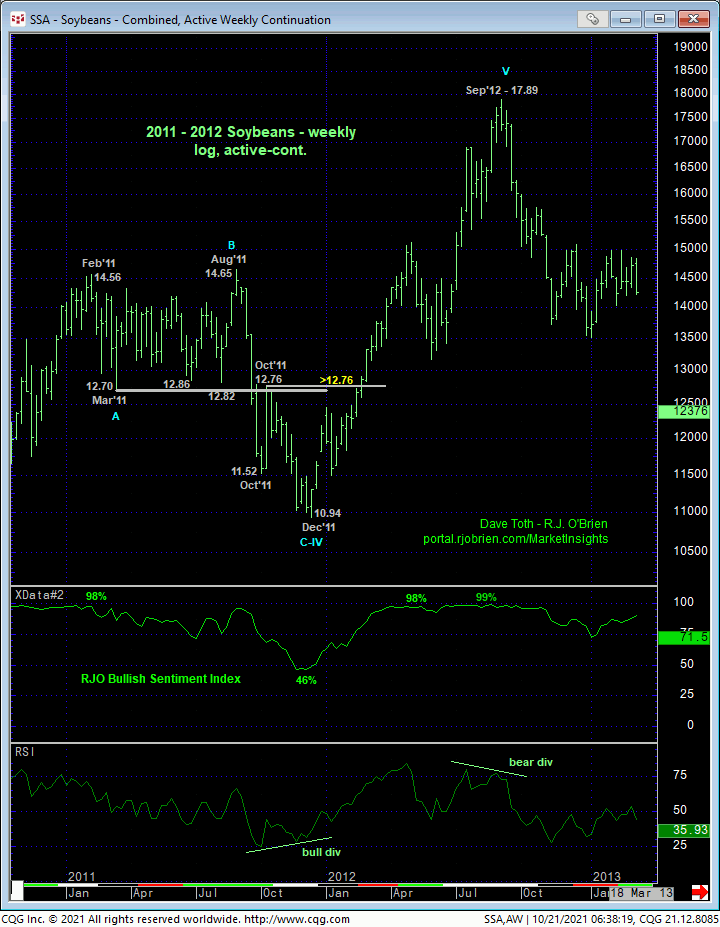
The weekly log active-continuation chart below details the price action during 2011 and 2012 where, after annihilating huge support around the 12.86-to-12.70-area in late-Sep’11 and continuing south into Dec that forced the Managed Money community to capitulate gross bullish exposure, the market, in early-Feb, failed miserably to sustain sub-12.70 levels and re-exposed the secular bull trend with a 5th-Wave to Sep’12’s infamous 17.89 all-time high.
Traders are urged to keep this 2011 – 2012 price action in mind in the weeks and even months or quarters ahead, especially when this market breaks a trend or reinforces one. Currently, the longer-term trend remains clearly down, but the market’s not far from threatening it with a recovery above 12.59 and subsequently negating it with commensurately larger-degree strength above 12.97. In lieu of such strength, a bearish policy and exposure remain advised. End-users don’t need upside bull-hedge protection until and unless the market recoups at least 12.59 and preferably 12.97. Conversely, bear-hedges remains advised for producers until and unless the market recoups at least 12.59 and preferably 12.97.
