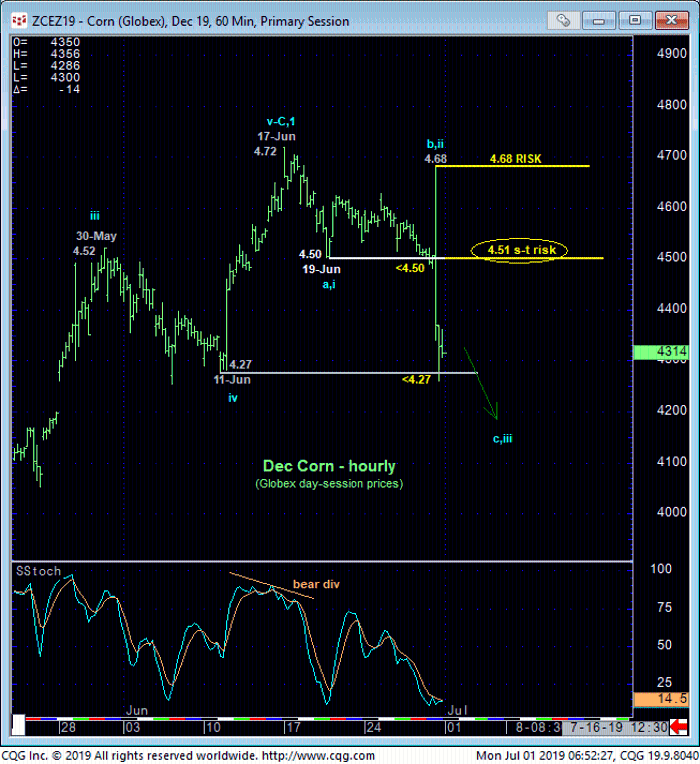
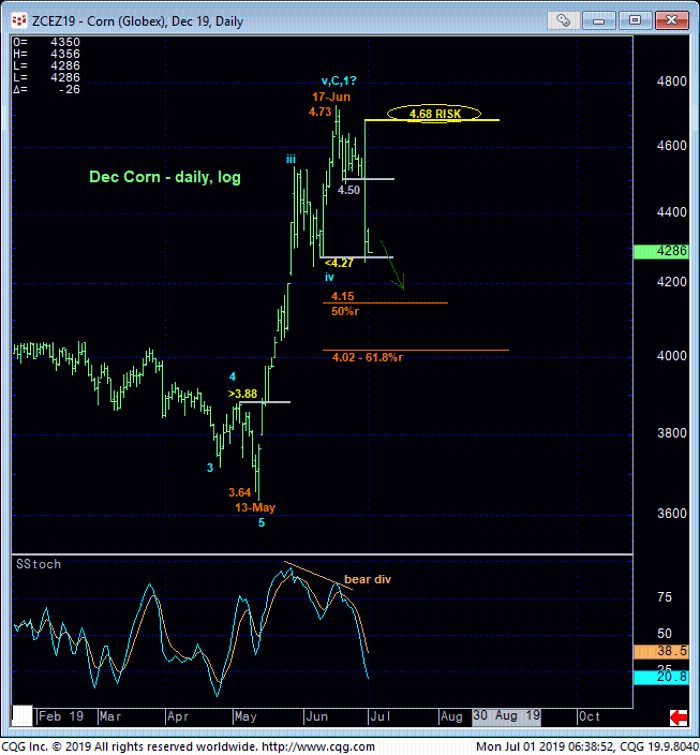
After Fri’s initial knee-jerk reaction to a 4.68 high, the extent and impulsiveness of its ultimate break below 19-Jun’s 4.50 initial counter-trend low confirms the bearish divergence in momentum needed to confirm 17-Jun’s 4.73 high as the END of a 5-wave sequence up from 13-May’s 3.64 low in the Dec contract as labeled in the daily log chart below. The market has identified Fri’s 4.68 high as the latest smaller-degree corrective high and new key risk parameter from which all non-bullish decisions like long-covers and cautious bearish punts can now be objectively based and managed.
Former 4.50-area support is considered new near-term resistance and arguably a short-term risk parameter, but given recent volatility the advantage of such a tighter bear risk level comes in exchange for whipsaw risk.
As for the market’s downside potential, we believe it is wide open given 1) the market’s obvious rejection of the 4.50-area that has marked the top boundary of a range that has dominated prices for the past FOUR YEARS and 2) the quick reversal in Managed Money bullish exposure from a low not seen in 14 years to its highest, most frothy level in three years. Such a reversal from a lowly 27% in our RJO Bullish Sentiment Index to Fri’s 75% high comes as no surprise at all given the extent and impulsiveness of May-Jun’s rally. And combined with a confirmed bearish divergence in momentum, neither should a correction or reversal lower come as a surprise.
The rejected/defined high at 4.68 is easy to see as a relevant risk parameter from which non-bullish decisions can be objectively based and managed. As for the market’s downside potential heading forward, at this juncture it has to be approached as indeterminable until stemmed by a countering bullish divergence in momentum. The Fibonacci retracements noted in the daily log chart of the Dec contract above and weekly log active-continuation chart below are merely “points of interest”- NOT support- around which to beware any relapse-stemming mo failure.
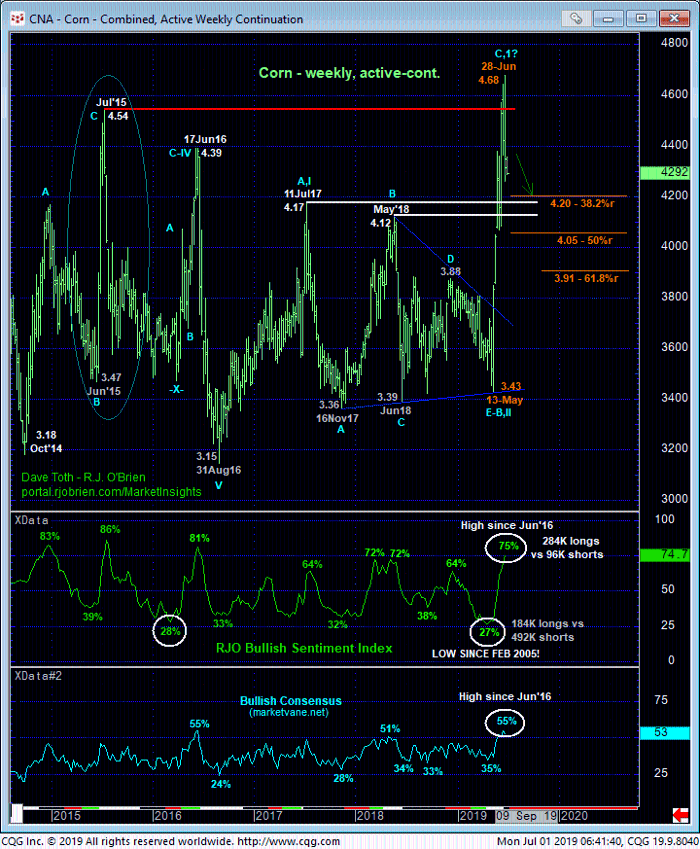
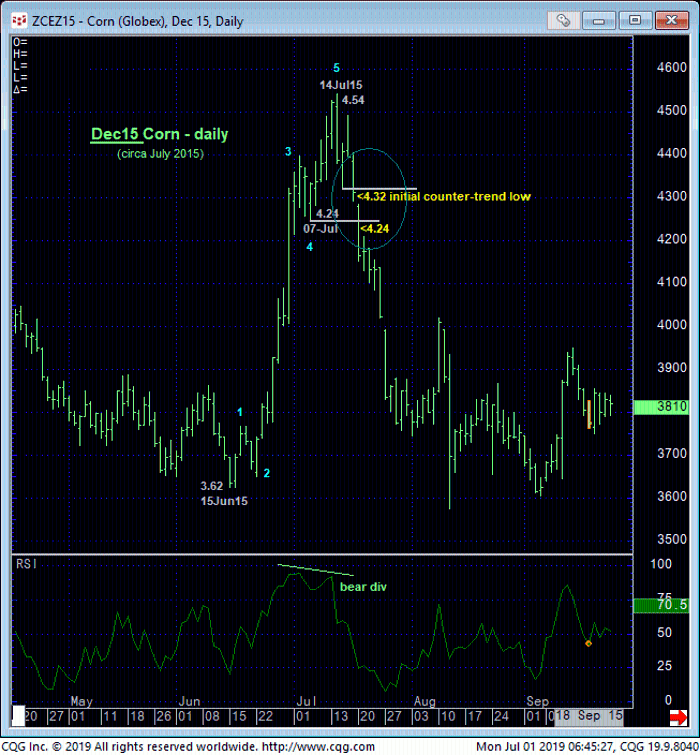
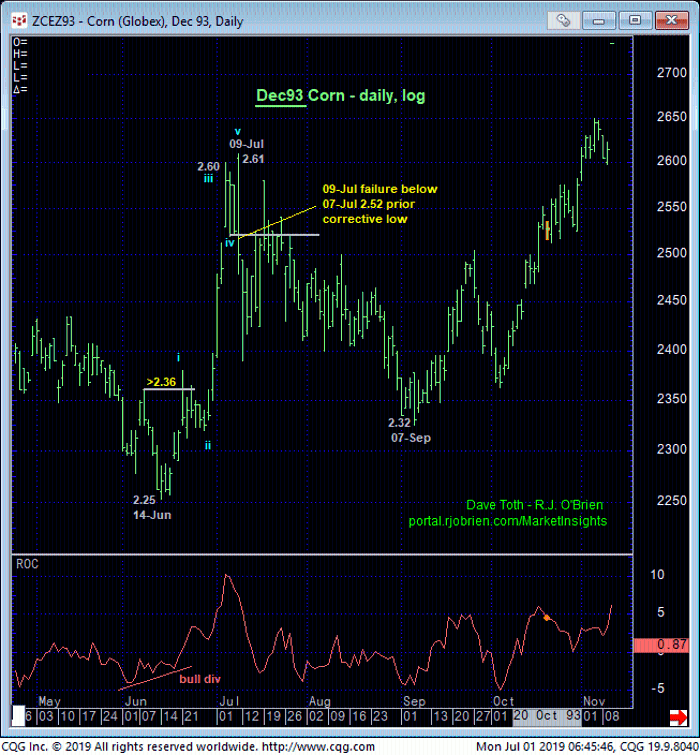
In 26-Jun’s Technical Blog we looked at two previous peak/reversal-threat technical conditions that were similar to the past month’s historic rally: the pertinent Dec contract for the summers of 2015 (above) and 1993 (below). In 2015 the market reversed the entire May-Jun rally and reached a new low. IN 1993 the market corrected- extensively but a correction nonetheless- Jun-Jul’s rally before resuming a major base/reversal process.
In this year’s case and given that we’ve been able to identify an end (4.73) to May-Jun’s rally, we can conclude that the market is in AT LEAST a larger-degree correction of the recent 3.64 – 4.73 rally. We will be watchful for proof of labored, corrective behavior on recovery attempts in the days and weeks immediately ahead as favorable risk/reward selling opportunities within a prospective larger-degree correction that could span a month or two OR a more severe reversal lower. IF, on a broader weekly scale this sell-off attempt becomes labored and then stemmed by a bullish divergence in momentum at a level above 13-May’s 3.64 low, long-term players may have a major bullish risk/reward opportunity presented. But we can only address that bridge when the market gets us there.
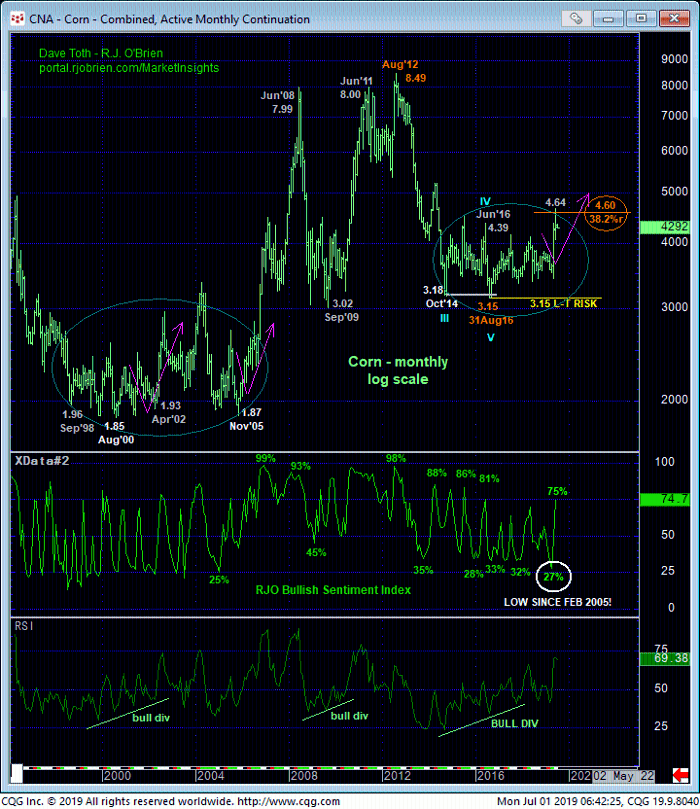
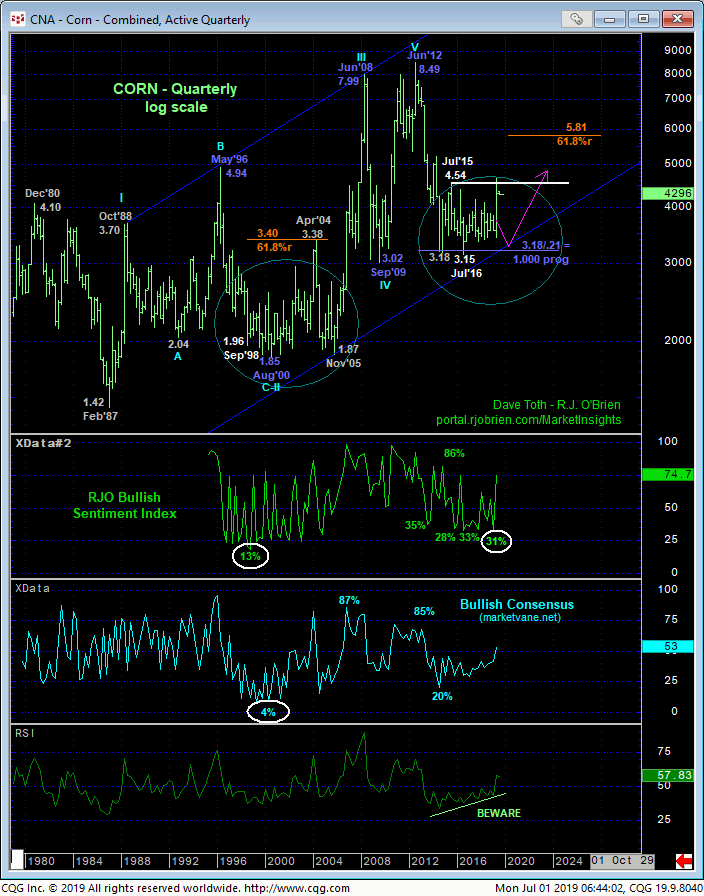
From a very long-term historic perspective, and again, this market’s price action from Oct’14’s 3.18 low remains identical to that that stemmed from Sep’98’s 1.96 low and remains the basis for our long-term, multi-year BASE/reversal count. But whether or not this market still has 2003- or 2004-type setbacks within this major base/reversal process remains anyone’s guess.
Indeed, looking at the quarterly log chart below, the market severely tested Aug’00’s 1.85 low with 2004-05’s major relapse, and this followed a steep 61.8% retrace of 1996 – 2000’s entire 4.94 – 1.85 secular bear market. Insane. But throughout that entire MULTI-YEAR base/reversal process, the market never took out Aug’00’s 1.85 low. Applied to the past 3-to-4-year process we believe this market will trade north of 5.00 before it breaks 3.15.
These issues considered and as a result of Fri’s relapse, all previously recommended bullish exposure has been neutralized and traders are advised to move to a bearish policy of approaching recovery attempts to 4.40 OB as corrective selling opportunities with a recovery above 4.51 and/or 4.68 (commensurate with one’s personal risk profile) required to threaten or negate this call and warrant paring or covering bearish exposure. End-users would be advised to neutralize any bull hedges discussed in last week’s blogs while producers are obviously advised to maintain bear hedges until and unless the market recovers above 4.68. The market’s downside potential is considered indeterminable and potentially significant in the weeks or perhaps months ahead.
