Posted on Aug 29, 2022, 11:26 by Dave Toth
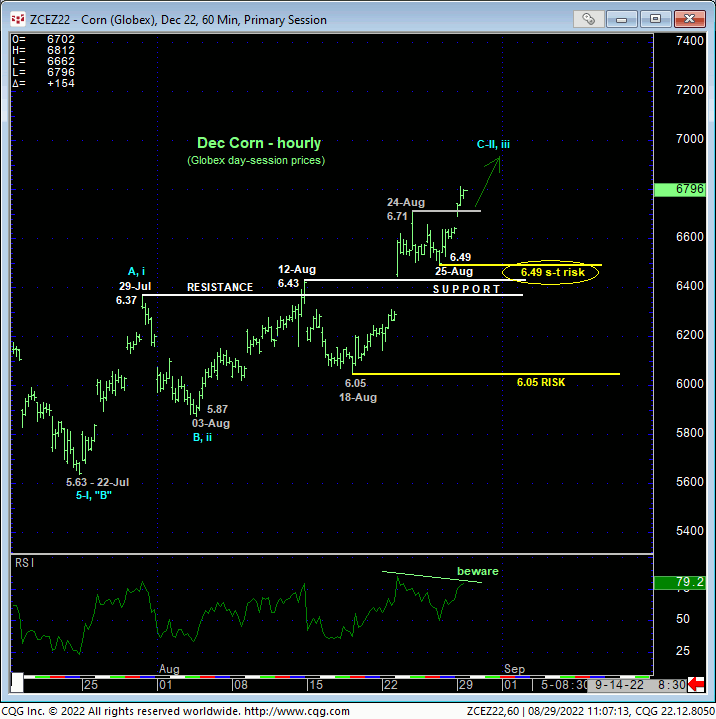
Today’s continued rally, this time above last week’s 6.71 high, reaffirms the developing (suspected corrective) recovery and defines new smaller- and larger-degree corrective lows at 6.49 and 6.05 this market is now required to sustain gains above to maintain a more immediate bullish count. Its failure to do so will threaten and then break the recovery from 22-Jul’s 5.63 low, jeopardize the impulsive integrity of a broader bullish count and contribute to what we believe is a major multi-month peak/reversal process. In lieu of such weakness, at least the intermediate-term trend remains up and should not surprise by its continuance or acceleration. Per such, 6.49 and 6.05 are considered our new short- and long-term risk parameters from which an interim bullish policy and exposure can be objectively rebased and managed.

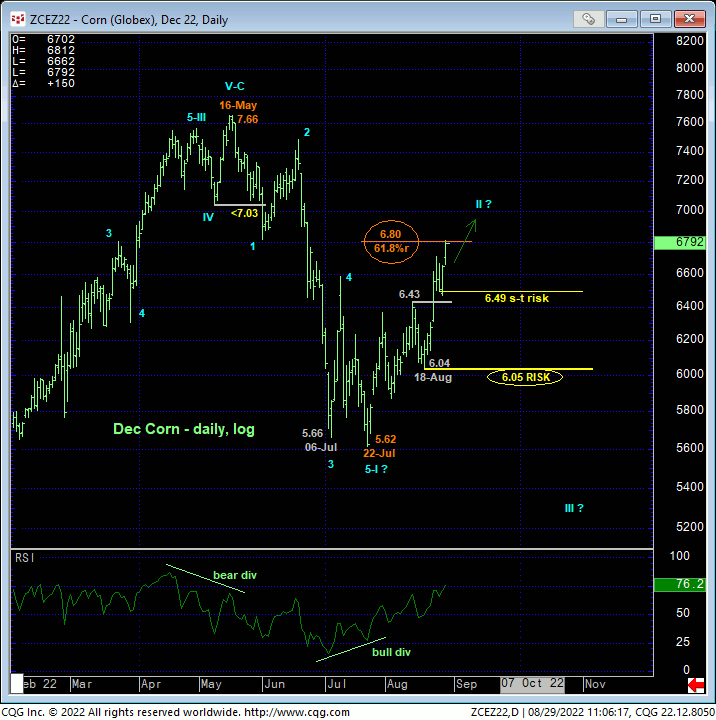
Stepping back, while the recovery from 22-Jul’s 6.62 low is not unimpressive, it remains well within the bounds of our major peak/reversal count and process from 16-May’s 7.66 high where, in 26-Jul’s Technical Webcast, we discussed a more “extensive” corrective rebuttal, in terms of both price and time, to May-Jul’s 7.66 -5.62 initial 5-wave decline. The daily log chart above shows the market thus far retracing exactly 61.8% of the 7.66 – 5.62 decline over a 5-week period, putting this market in the prospective wheelhouse of where and when a more “extensive” correction might peter out.
But we would remind traders that merely “derived” technical levels like trend lines, various “bands”, imokus, the ever-useless moving averages and even the vaunted Fibonacci relationships we cite often in our analysis are basically useless and are certainly not considered resistance in the absence of an accompanying CONFIRMED bearish (in this case) divergence in momentum. Herein lies the importance of the recent corrective lows and risk parameters we’ve identified at 6.49 and especially 6.05, where a confirmed divergence will combine with this fib retracement for a favorable and possibly powerful risk/reward opportunity from the bear side. Until and unless a mo failure arrests the clear and present uptrend, further gains should not surprise.

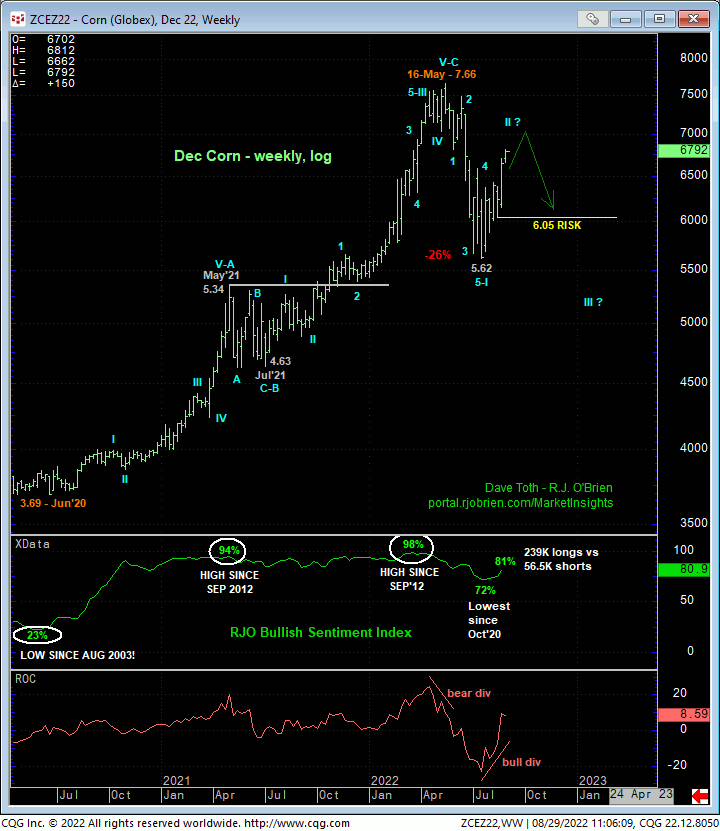
Moving out even further to a weekly log scale perspective, the chart below shows a still-frothy 81% reading in our RJO Bullish Sentiment Index of the hot Managed Money positions reportable to the CFTC. Such a bullish skew is typical of broader peak/reversal environments. But here too, sentiment/contrary opinion is not an applicable technical tool in the absence of an accompanying confirmed momentum failure needed to, in fact, arrest the clear and present uptrend. Until and unless this market fails below at least 6.49 and preferably 6.05, the trend is up and should not be underestimated as its upside potential is indeterminable given that there are NO levels of any technical merit above the market between spot and May’s 7.66 high.
These issues considered, an interim bullish policy and exposure remain advised with a failure below 6.49 required for shorter-term traders to move to the sidelines and commensurately larger-degree weakness below 6.05 for longer-term commercial players to follow suit AND reverse into a new bearish policy. In lieu of such weakness, further and possibly accelerated gains should not surprise.


