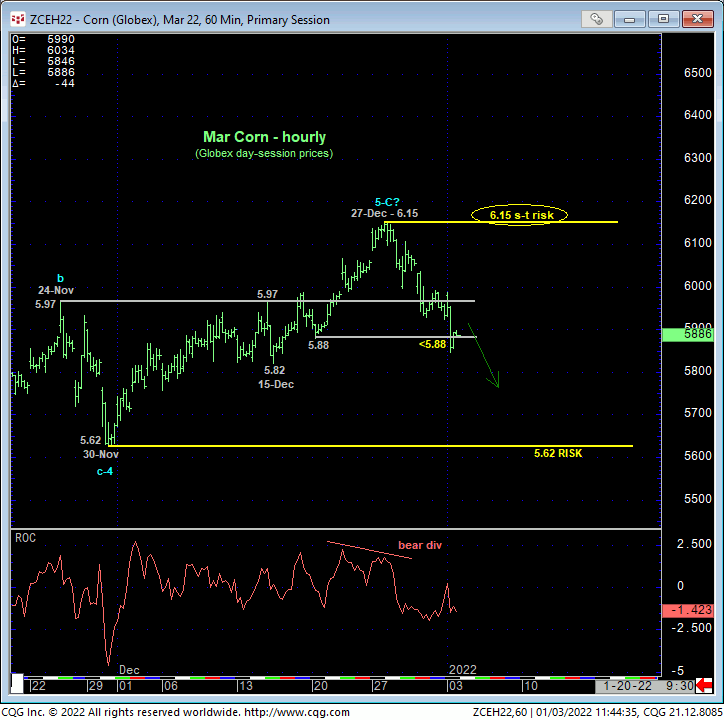
In last week’s Technical Blog we acknowledged the Mar contract’s poke into the upper-quarter of its 6.41 – 5.07-range amidst historically frothy bullish sentiment and a possibly complete 5-wave Elliott sequence from 10-Sep’s 5.07 low that required the market to sustain gains above at least 20-Dec’s 5.88 smaller-degree corrective low in order to maintain the risk/reward merits of a bullish policy. The hourly chart below shows the market’s failure to do so, confirming a bearish divergence in momentum that defines 27-Dec’s 6.15 Globex day-session high as one of developing importance and possibly the start of a more protracted correction of the past 3-1/2-month rally. Per such, this 6.15 high is considered our new short-term risk parameter from which traders can objectively base non-bullish decisions like long-covers and interim bearish punts.


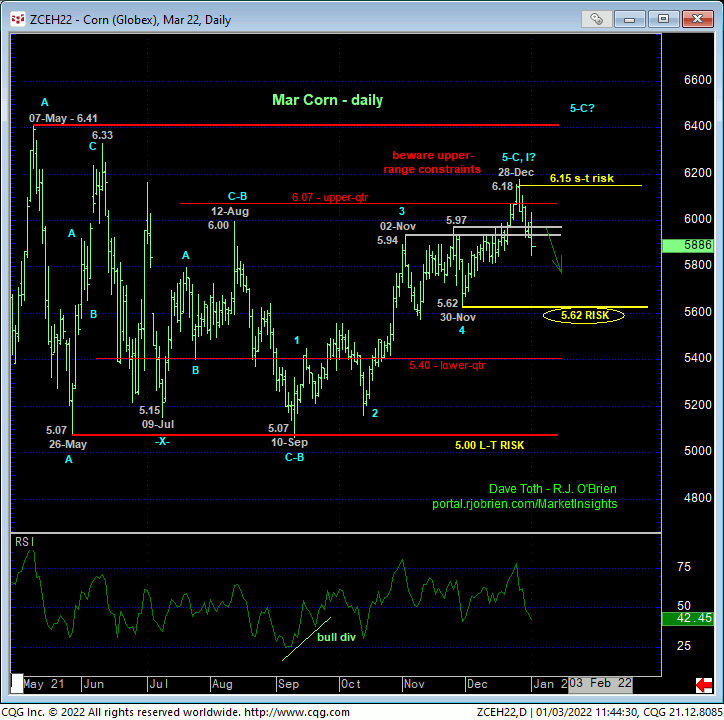
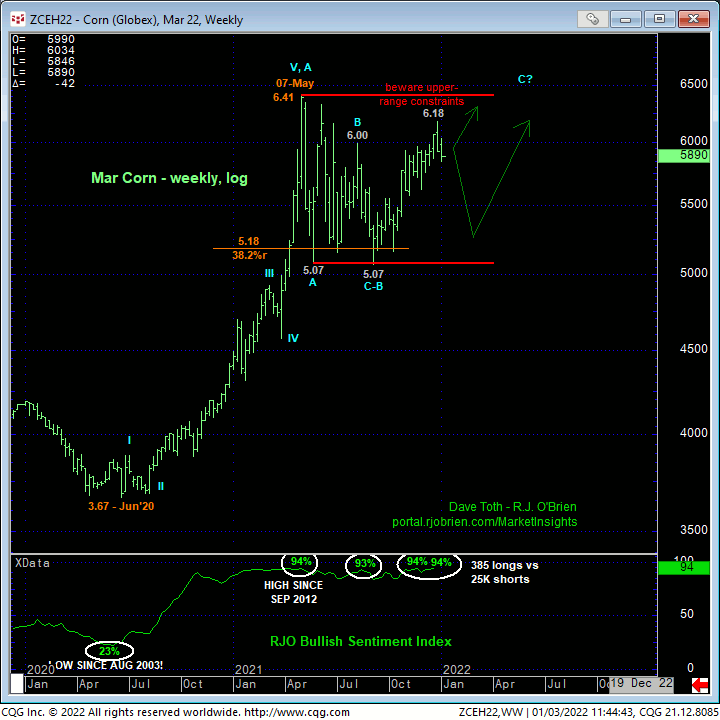
The daily chart above and weekly log chart below of the Mar contract show the intra-range peak/correction/reversal-threat elements that include:
- a confirmed bearish divergence in short-term mo discussed above
- the market’s rejection thus far of the upper-quarter of the 7-month range
- an arguably complete (textbook) 5-wave Elliott sequence up from 10-Sep’s 5.07 low, and
- still-stratospheric levels in our RJO Bullish Sentiment Index.
While commensurately larger-degree weakness below 30-Nov’s 5.62 corrective low and key longer-term risk parameter remains required to, in fact, break Sep-Dec’s uptrend, it’s hard to not question the risk/reward metrics of a continued bullish policy “up here” following an admittedly short-term mo failure given the extent to which the Managed Money community has its neck sticking out on the bull side. Indeed, at a current 94% reading reflecting a whopping 385K long positions to just 25K shorts reportable to the CFTC, this indicator reinforces a peak/reversal count until and unless negated by a recovery above last week’s 6.15 high and new short-term bear risk parameter.

From an even longer-term perspective, it will take a monumental failure below 10-sep’s 5.07 low to negate or long-term bullish count that contends that the past seven months’ mere lateral chop is a major corrective/consolidative event that warns of an eventual resumption of 2020 – 2021’s secular bull trend. But until and unless the current shorter-term peak/reversal-threat elements are negated by a recovery above at least 6.15, another intra-range relapse like those from last Jun and Aug-Sep should not surprise.
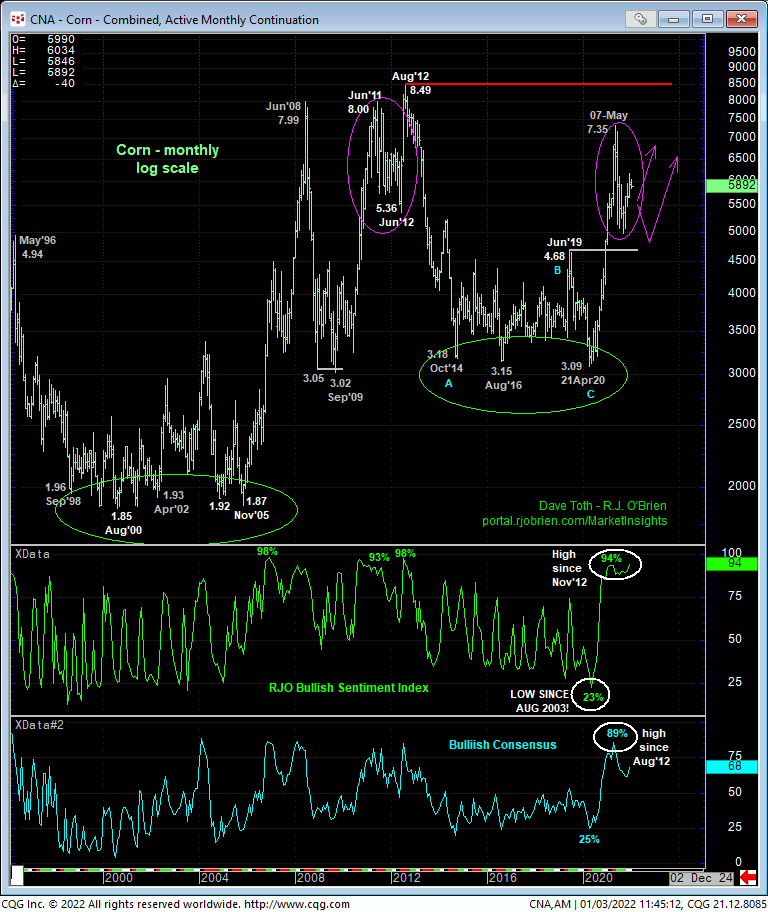
Additionally, we’ve compared the price action from last May’s high to the major correction that unfolded between Jun’11 and Jun’12 before 3Q12’s volatile resumption of that secular bull trend. In this very long-term regard, this summer’22 could be extraordinary in terms of volatility and a final 5th-Wave resumption of the secular bull trend. Between now and then however, and unless this market can recoup 6.15, this volatility could easily be exacted on the bear side.
These issues considered, shorter-term traders have been advised to move to a neutral/sideline policy as a result of today’s short-term mo failure below 5.88. We will be watchful for proof of labored, 3-wave corrective behavior on a subsequent recovery attempt for a preferred risk/reward opportunity from the bear side. Longer-term commercial players are advised to pare bullish exposure to more conservative levels and jettison remaining exposure on a failure below 5.62 ahead of a correction or reversal lower that could be extensive in scope. Needless to say, a recovery above 6.15 mitigates these peak/reversal elements, reinstates the bull and exposes potentially steep gains thereafter.


