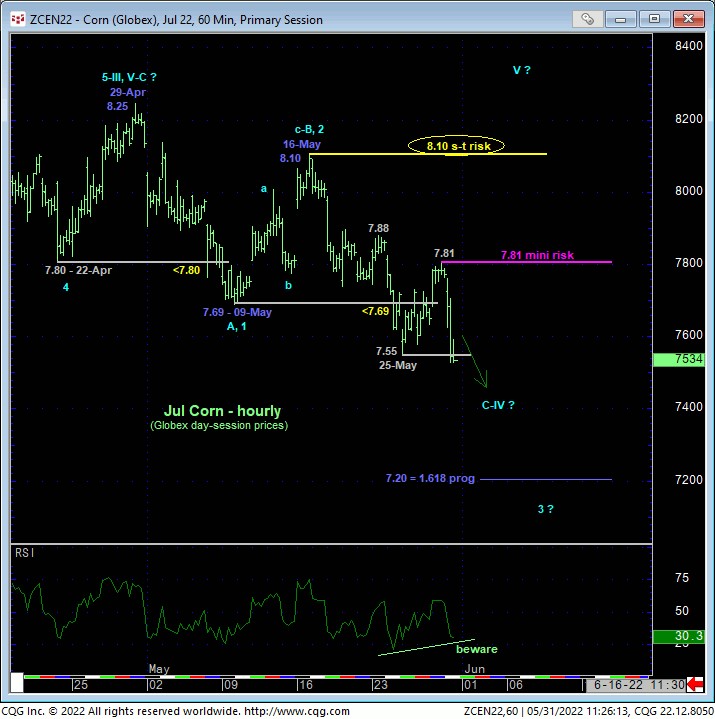
Today’s break below last week’s 7.55 low reinforces a broader peak/correction/reversal threat resurrected in 20-May’s Technical Blog and leaves Fri’s 7.81 high in its wake as the latest smaller-degree corrective high and new mini risk parameter from which non-bullish decisions like long-covers and bearish punts can now be objectively rebased and managed. On an intermediate-term basis, a recovery above 16-May’s 8.10 next larger-degree corrective high remains required to render the sell-off attempt from 29-Apr’s 8.25 high a 3-wave and thus corrective affair that would then re-expose the secular bull market. Per such, this 8.10 level remains intact as our short-term but key bear risk parameter.
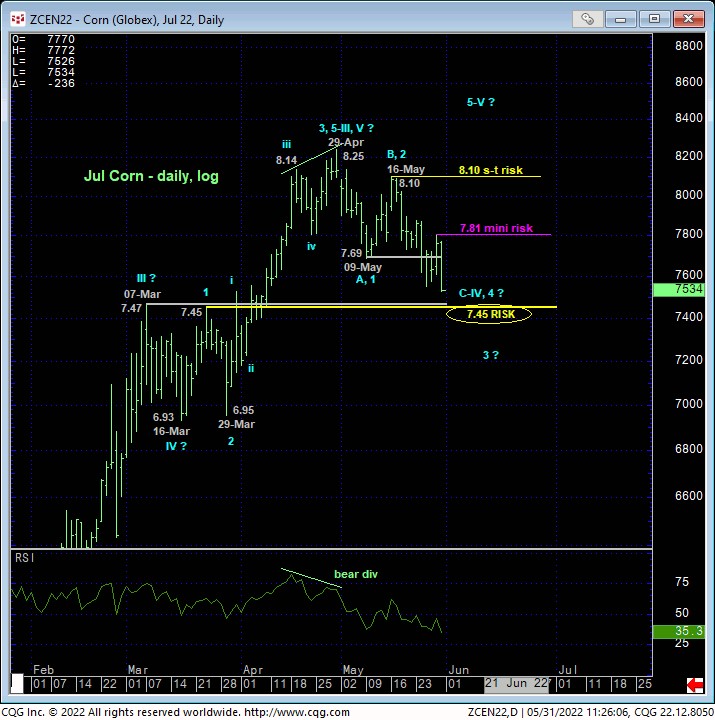
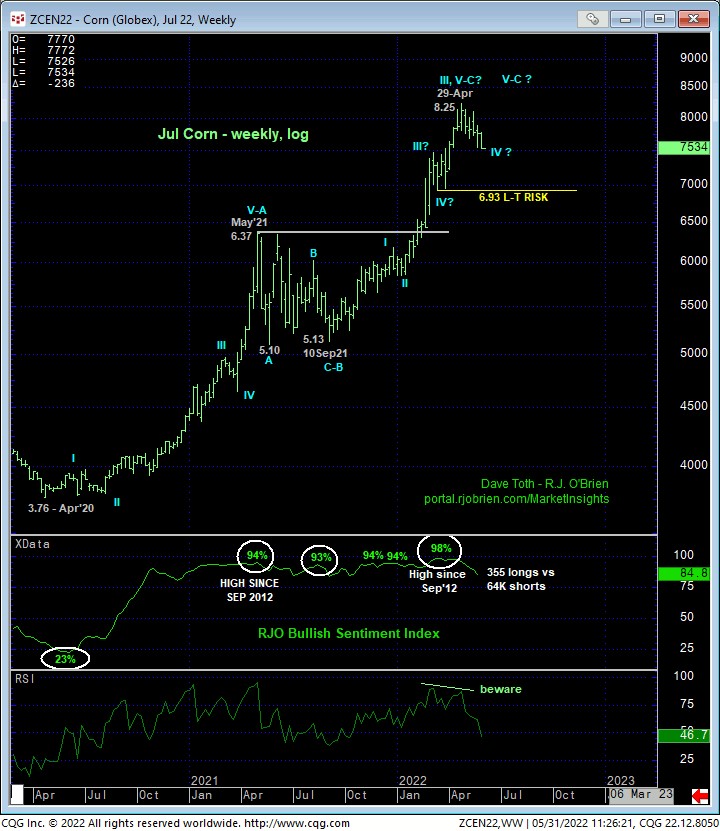
From a long-term perspective the extent of this month’s relapse thus far remains well within the bounds of another correction. Indeed, the market remains above key former resistance-turned-support from Mar around 7.45, with a break below 16-Mar’s 6.93 major corrective low arguably required to, in fact, break the uptrend from even 10Sep21’s 5.13 low, let alone the 2-YEAR secular uptrend. Per such, 7.45 remains intact as our longer-term bull risk parameter pertinent to longer-term commercial players. BUT IF the decline from 29-Apr’s 8.25 high is just a correction, today’s resumed slide helps us to identify specific corrective highs and bear risk parameters like 7.81 and especially 8.10 that we can now require the market to recoup to arrest the clear and present and at least intermediate-term slide and resurrect chances for the secular bull.
With last week’s break below 09-May’s 7.69 low, we can surmise that the current decline from 16-May’s 8.10 high is either the completing C-Wave of a major bull market correction OR the dramatic 3rd-Wave of a probable broader reversal lower. As 3rd-waves are dramatic, directional, uninterrupted and increasingly obvious beasts, the bear has every opportunity to PERFORM to the downside straight away. There should be little question as to its directional intent. Such a 3rd-wave would not only be expected to NOT include a recovery above 8.10 or even 7.81 at this juncture, but also to fall completely apart straight away.
From an Elliott Wave perspective, we continue to act on the premise that, at this juncture, it is indeterminable whether the rally from Sep’21’s 5.13 low to 29-Apr’s 8.25 high is a 3- or 5-wave structure. As the error in assuming the market only completed 3-waves (suggesting the current setback is a 4th-wave correction) is much more egregious than assuming 5-waves were completed, traders are advised to first act on the premise that 5-waves were completed and that a major correction or reversal lower is underway, A recovery above at least 7.81 and certainly 8.10 is required to mitigate and then negate such a bearish count.
These issues considered, shorter-term traders remain advised to maintain a bearish policy and exposure with a recovery above 7.81 (tight and/or 8.10 required to threaten and then negate this call, warranting its cover. Longer-term commercial players remain OK to maintain a bullish policy with a failure below 7.45 required to threaten this call enough to warrant its cover/hedge ahead of further and possibly protracted losses thereafter. Longer-term players also have the option of neutralizing bullish exposure and acknowledging and accepting whipsaw risk, back above at least 7.81 and certainly 8.10, in exchange for deeper nominal risk below 7.45 and/or 6.93.
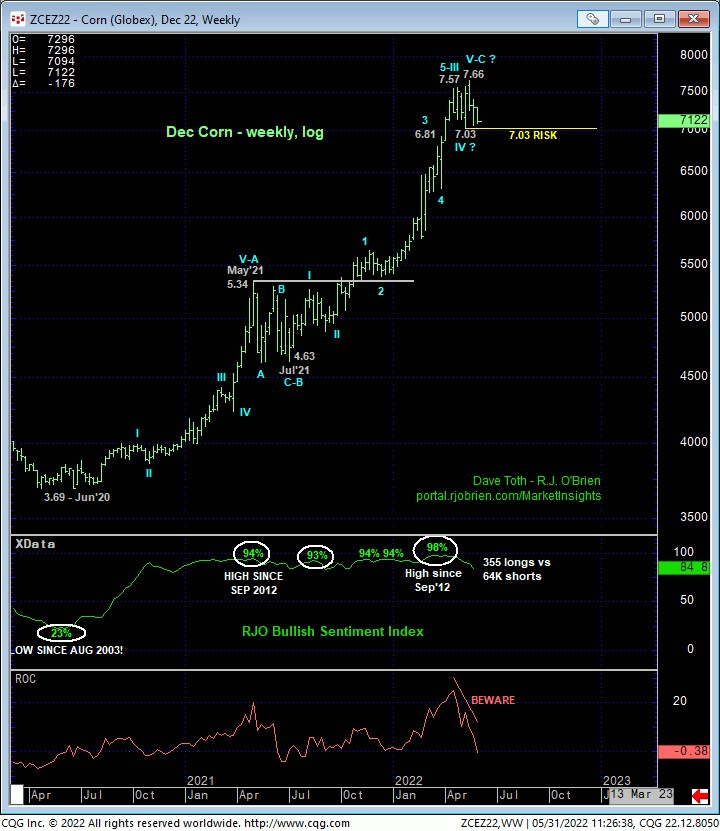
DEC CORN
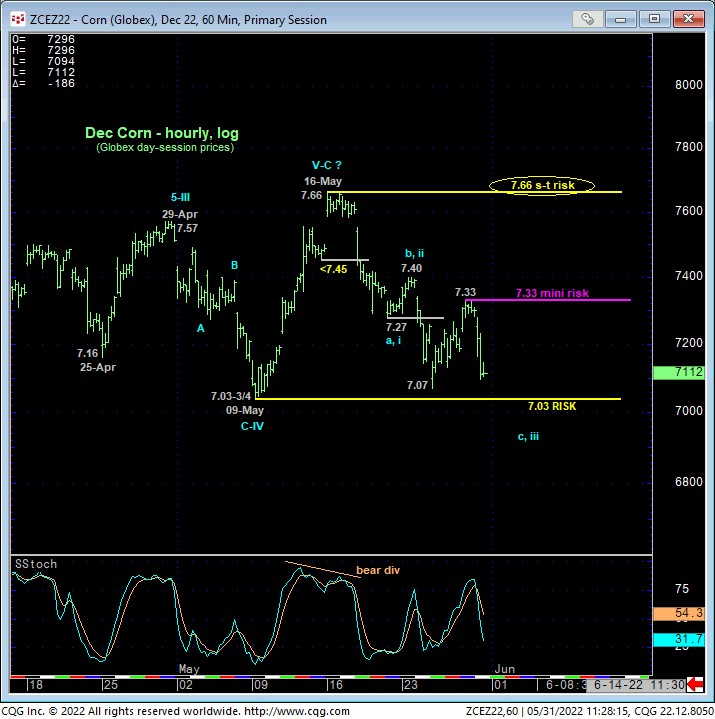
The hourly chart of the Dec contract below shows that the market has yet to break last week’s 7.07 low, let alone 09-May’s pivotal 7.03 low. But today’s relapse is ominous with the market just spittin’ distance from these key lows and support, the break of which will confirm a bearish divergence in DAILY momentum that could similarly threaten the major bull trend. Per such and while that 7.03 low remains intact as a pivotal long-term bull risk parameter, traders are advised that Fri’s 7.33 high serves as our new mini risk parameter (trailed from 23-May’s 7.40 high) from which non-bullish decisions can be objectively rebased and managed.
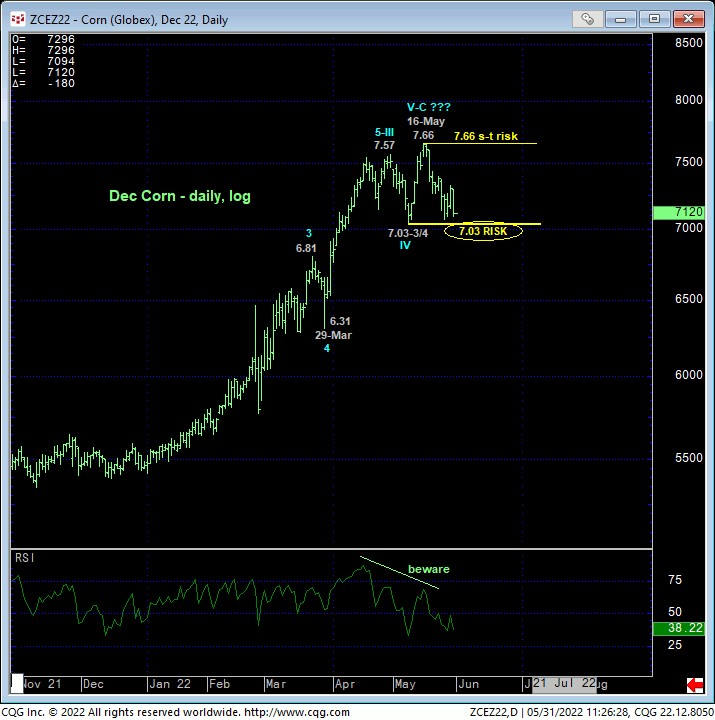
The daily log chart above shows the nicely developing potential for a bearish divergence in momentum. A break below 7.03 will CONFIRM this indicator to the point of non-bullish action by longer-term commercial players like long-covers, cautious bearish punts and bear hedges by producers. With recent historically-skewed bullish sentiment, the extent of an initial (A- or 1st-Wave) counter-trend decline is indeterminable and potentially steep.
These issues considered, we believe this market has identified 7.33 and 7.03 as the key directional flexion points heading forward. Traders are advised to toggle directional biases and exposure around these levels commensurate with their personal risk profiles.