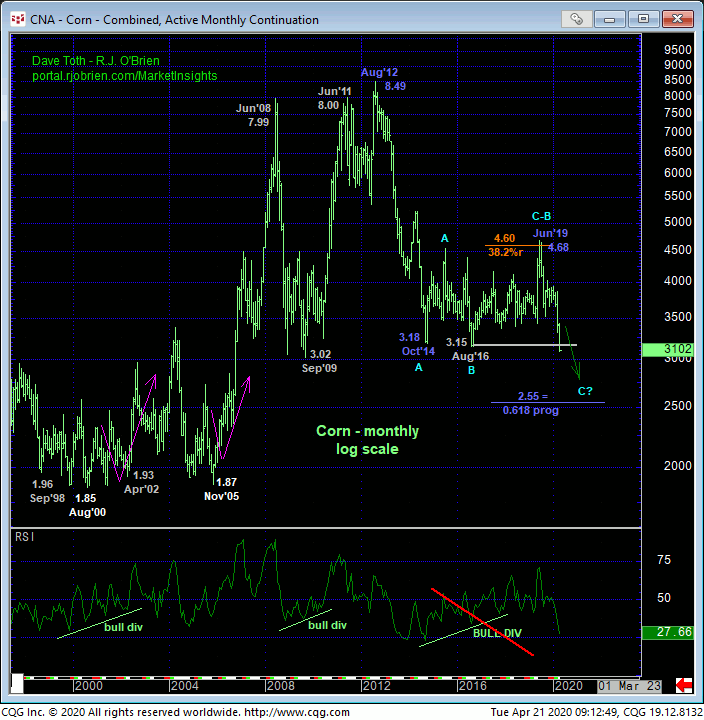
Today’s break below Aug’16’s 3.15 low and our secular risk parameter nullifies May’19’s bullish divergence in MONTHLY momentum, chalks up all of the price action from Oct’14’s 3.18 low as a corrective/consolidative structure and reinstates the secular bear trend that dates from Aug’12’s 8.49 high. In breaking that pivotal 3.18-to-3.15-area, the market has exposed a vast chasm totally devoid of any technical levels of merits. In effect, there is no support. The only levels of any technical merit now exist only above the market in the form of former support-turned-resistance and prior corrective highs. We’ll address these levels below.
What’s likely on most traders’, producers’ and end-users’ minds is how low can this thing go. Of course, there is no objective answer to this question. What is specific and objective however is where the bear SHOULD NOT trade for it to remain intact. And again, we will address these specifics below. What’s crucial now is to not underestimate this market’s downside potential. And as always, referring to this (or any market under these circumstances) as “oversold” is inept and outside the bounds of prudent technical discipline.
In the for-what-it’s-worth-department, and admitting our disdain for mere;y “derived” technical levels, the 0.618 progression of 2012-14’s 8.49 – 3.18 decline from Jun’19’s 4.68 corrective high cuts across at 2.55. We are not forecasting a move to 2.55. But until and unless this market stems the clear and present and secular bear trend with a confirmed bullish divergence in momentum, ANY amount of downside is in the cards, including a run to 2.55 or lower.


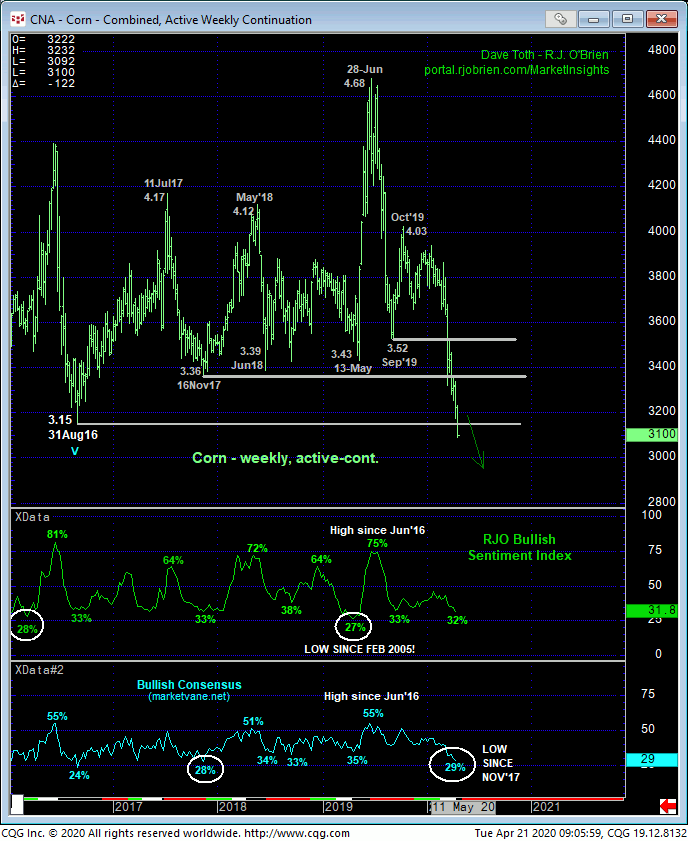
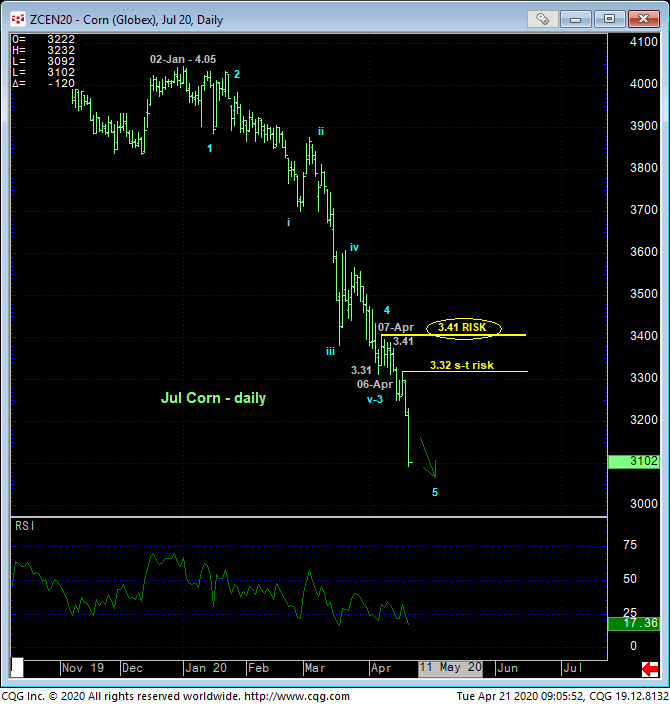
Only a glance at the weekly (above) and daily (below) chart is needed to see that the trend is down on all scales. We’ve no doubt that historically bearish sentiment will eventually contribute mightily to a BASE/reversal environment that will be major in scope. But traders are reminded that sentiment/contrary opinion is not an applicable technical tool in the absence of an accompanying confirmed bullish divergence in momentum.

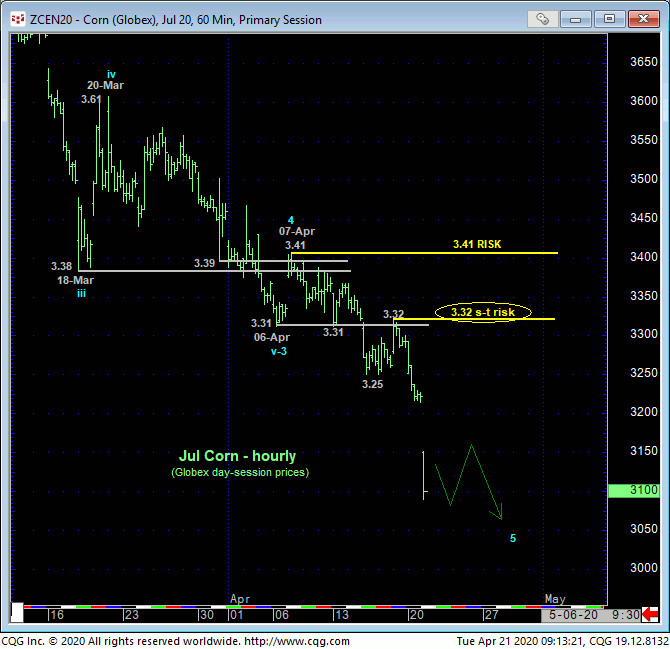
On a shorter-term, more practical scale, today’s continued weakness leaves smaller- and larger-degree corrective highs in its wake at 3.32 and 3.41, respectively. These areas also identify former support-turned-resistance and are the specific levels and conditions this market needs to recover above to even defer, let alone threaten the major bear trend. Per such, these levels are considered our new short- and long-term risk parameters to a still-advised bearish policy.
In sum, a bearish policy and exposure remain advised with a recovery above at least 3.32 and preferably 3.41 required to threaten this call enough to warrant defensive steps like short-covers and pared bearish exposure. In lieu of such specific strength, further and possibly protracted losses should not surprise, including a run at the 2.50-area.


