DEC CORN
We’ve been discussing the importance of 29-Aug’s 3.77 corrective high as a short-term but important risk parameter the bear needed to sustain losses below since 03-Sep’s resumption of a relapse that dates from 17-Jun’s 4.73 high in the Dec contract. Today’s impulsive bust-out above last week’s 3.76-1/4 high and that 3.77 high from 29-Aug breaks the downtrend from at least 12-Jul’s 4.65 high, confirms at least the intermediate-term trend as up and leaves smaller- and large-degree corrective lows in its wake at 3.68 and 3.52 that the market is required to relapse below to threaten a broader base/reversal count and resurrect a broader bearish one. In this regard these 3.68 and 3.52 levels serve as our new short- and longer-term risk parameters from which traders can objectively base and manage non-bearish decisions like short-covers and new bullish punts.
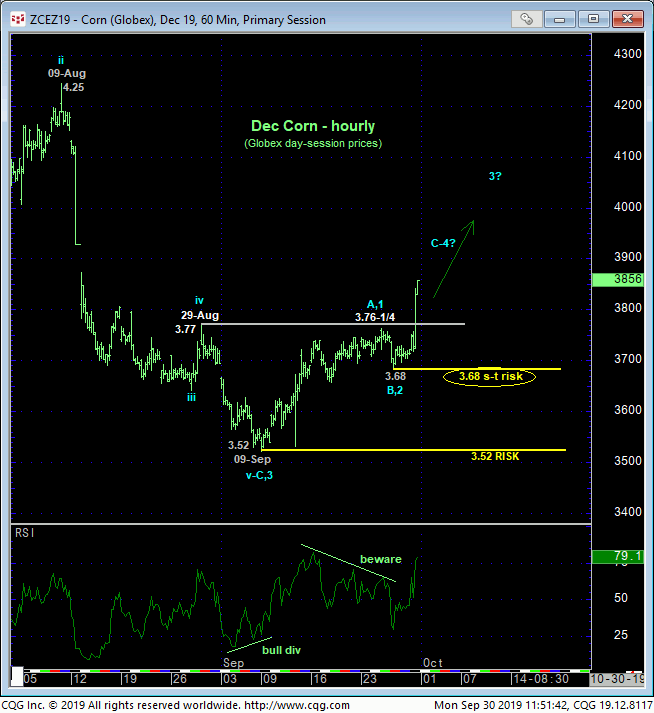
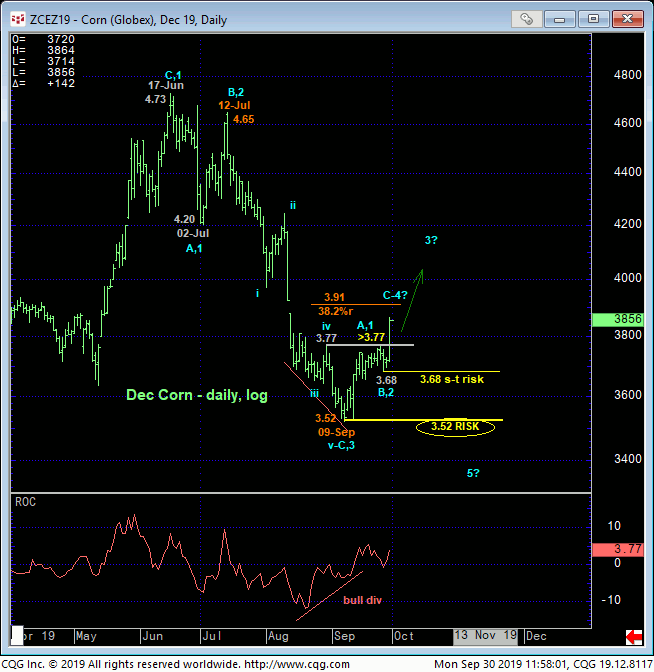
The market’s failure to sustain early-Sep losses below 3.77 confirms a bullish divergence in daily momentum above, in fact, breaking the 3-month downtrend. Relative to the magnitude of that downtrend, this month’s recovery arguably still falls within the bounds of a mere (4th-Wave) correction. But until this market relapses below at least Thur’s 3.68 corrective low and short-term risk parameter needed to arrest this recovery and resurrect such a bearish prospect, there ‘s no way to know the market isn’t embarking on the 3rd-Wave of a reversal higher that could be major in scope.
Indeed, we’ve discussed ad nauseam the 3.60-to-3.40-range circled in green below that the bear has failed miserably at for the past TWO YEARS. Especially with market sentiment/contrary opinion indicators showing that the huddled masses are once again short in the proverbial hole, today’s confirmed bullish divergence in momentum and break of the 3-month downtrend may again leave this market vulnerable to not only higher prices, but sharply higher prices like we’ve seen the past three years from sub-3.60 levels.
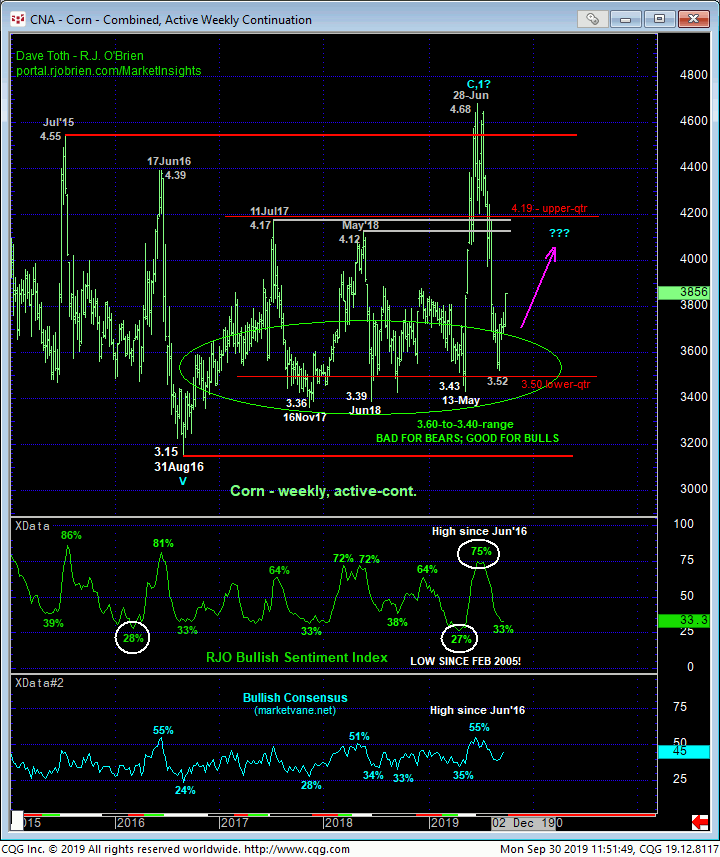
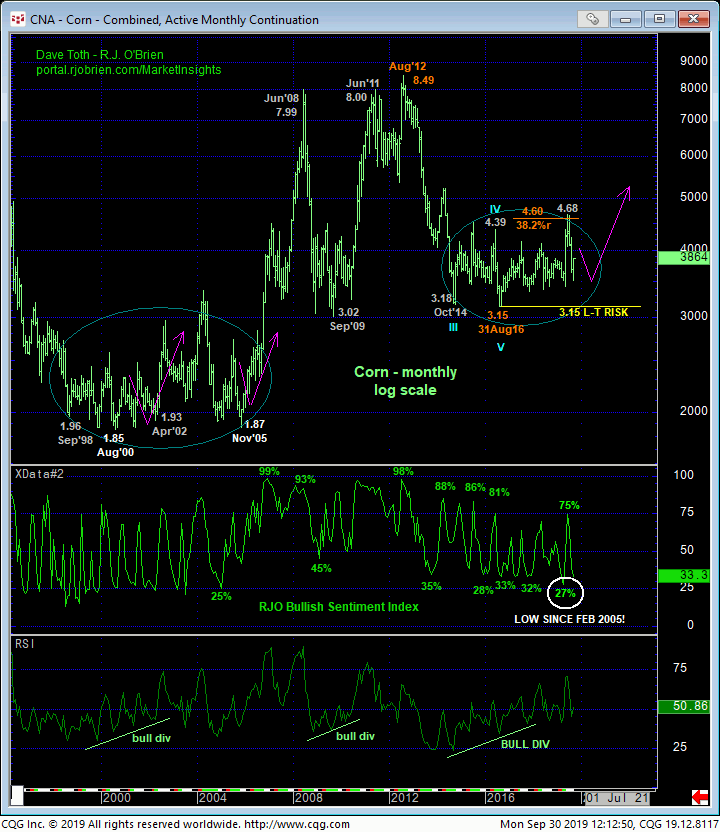
On an even broader monthly log scale basis below, we would remind traders once again that this market has shown NO evidence whatsoever since Aug’16’s 3.15 low that the price action from Oct’14’s 3.18 low is any different than the major, multi-year BASE/reversal environment that followed the Sep 1998 low at 1.96. The past five years’ merely lateral price action is virtually identical to that at the turn of the millennium that ultimately resulted in the next secular bull market. We’re not suggesting that this market will be trading above the summer’s 4.73 high before the next crop year, but we continue to maintain that the risk/reward merits for bears below 3.60 is horrendous while the risk/reward merits for long-term bulls is outstanding.
These issues considered, all previously recommended bearish policy has been nullified and advised to be covered. Heading forward, traders are advised to establish a new bullish policy and exposure from 3.85 OB with a failure below 3.68 to negate this specific count and warrant its cover. In lieu of at least such sub-3.68 weakness, further and possibly sharp, sustained gains straight away should not surprise. Producers would be advised to neutralize bear hedges until and unless this market relapses below at least 3.68 while end-users are advised be fully hedged until the market fails below at least 3.68 and preferably 3.52.
NOV SOYBEANS
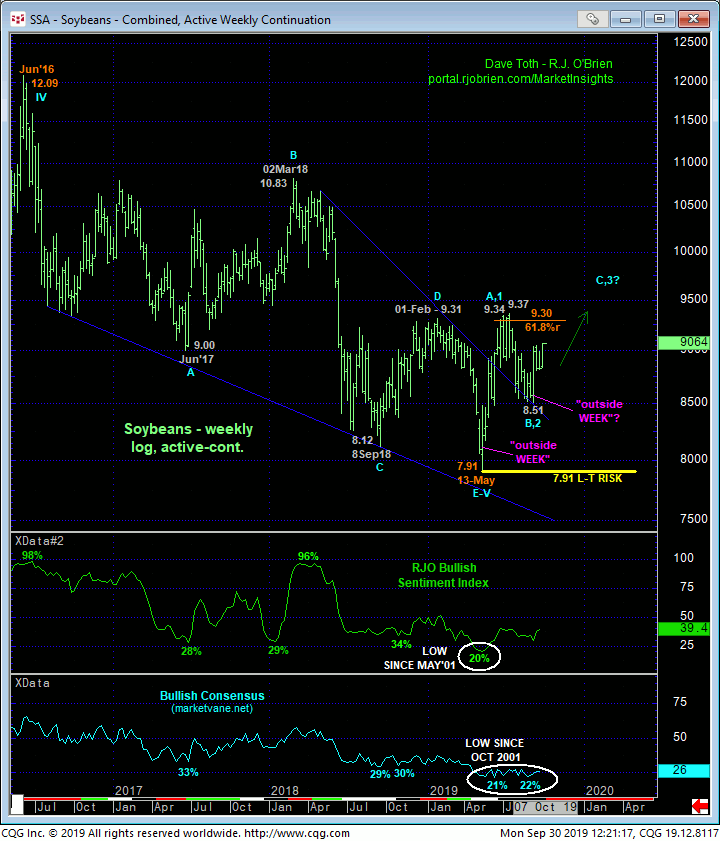
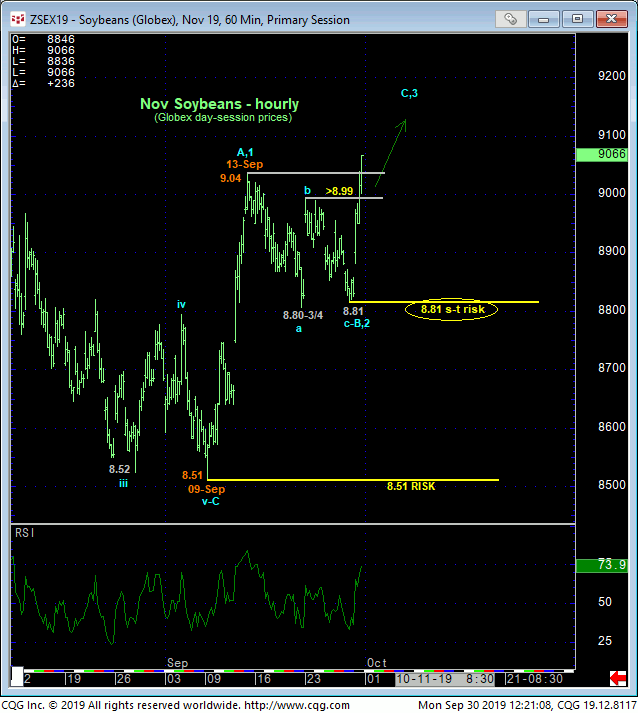
Today’s recovery above both our short-term risk parameter at 8.99 and 13-Sep’s 9.04 initial counter-trend high reaffirms our major base/reversal count introduced in 12-Sep’s Technical Blog and leaves Fri’s 8.81 low in its wake as the end of a labored, 3-wave corrective sell-off attempt from 13-Sep’s 9.04 high and our new short-term risk parameter from which a full and aggressive bullish policy and exposure can be objectively rebased and managed.
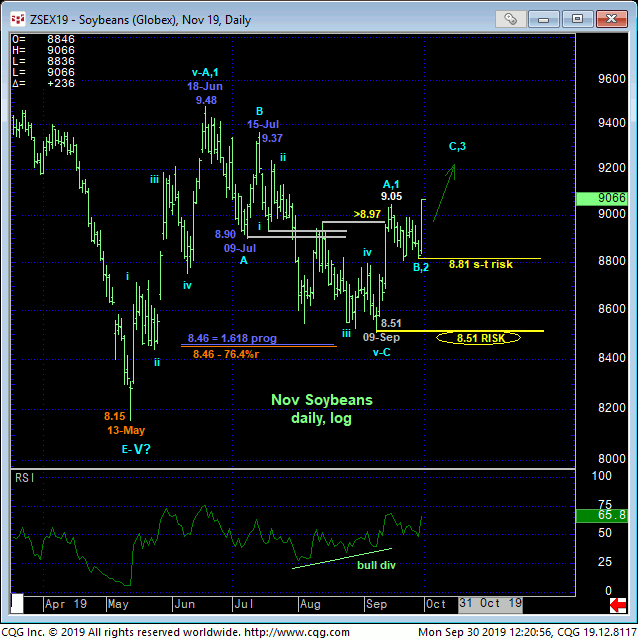
This resumed strength comes on the heels of 13-Sep’s bullish divergence in daily momentum that broke Jun-Sep’s downtrend and exposed the new longer-term trend as up. And given the extent and impulsiveness of May-Jun’s uptrend that preceded Jun-Sep’s 3=-wave correction, today’s reaffirmation of at least intermediate-term strength could morph into a (C- or 3rd-Wave) resumption of May-Jun’s uptrend that preceded it to new highs above 9.50.
Again, this resumed strength leaves smaller- and larger-degree corrective lows in its wake at 8.81 and 8.51, respectively. If a broader bullish count is wrong, all the bear has to do is prove weakness below these specific, market-defined levels and bull risk parameter. Until such weakness is proven, further and possibly steep, accelerated gains should not surprise.
Contributing mightily to this bullish count is market sentiment/contrary opinion that persists in wallowing around at historically low levels. Combined with 13-Sep’s bullish divergence in momentum and today’s resumption of that initial counter-trend rally, this historically bearish sentiment condition warns of this market’s vulnerability to potentially sharply higher prices straight away in the continuation of what we still believe is a major, multi-quarter BASE/reversal process.
In sum, a bullish policy remains advised for long-term players with a failure below 8.81 required to pare this exposure to more conservative levels and commensurately larger-degree weakness below 8.51 required to jettison the position altogether. Shorter-term traders are advised to re-establish bullish exposure at-the-market (9.04) OB with a failure below 8.81 required to negate this specific count and warrant its cover. In lieu of weakness below at least 8.81, further and possibly accelerated gains should not surprise straight away.
