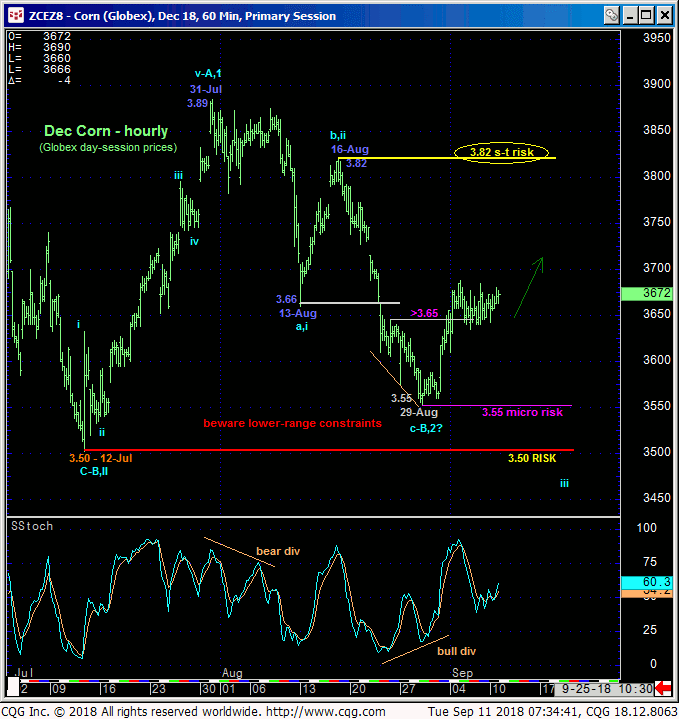
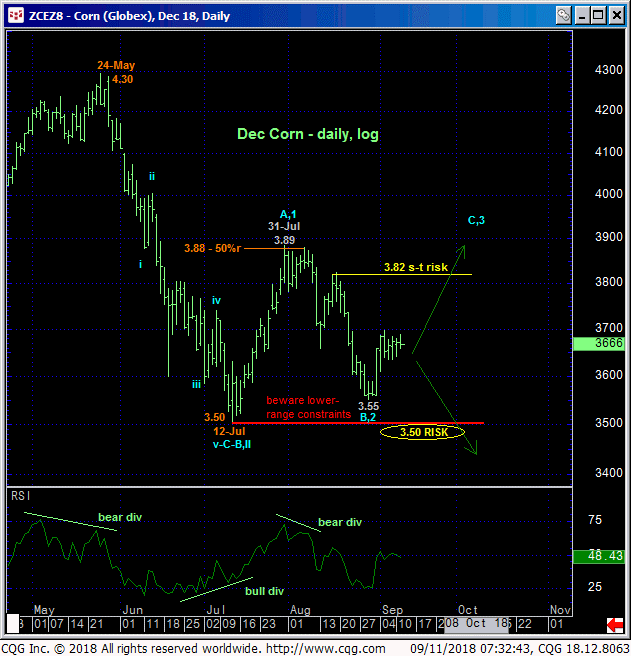
Our cautious bullish policy and exposure recommended in 30-Aug’s Trading Strategies Blog remains intact with protective sell-stops placed just below 3.55 for shorter-term traders and below 3.50 for long-term players. Strength above 16-Aug’s 3.82 high remains required however to render Aug’s relapse a 3-wave and thus corrective affair within the context of what we believe is a broader base/reversal environment and process from the 3.50-to-3.35-range.
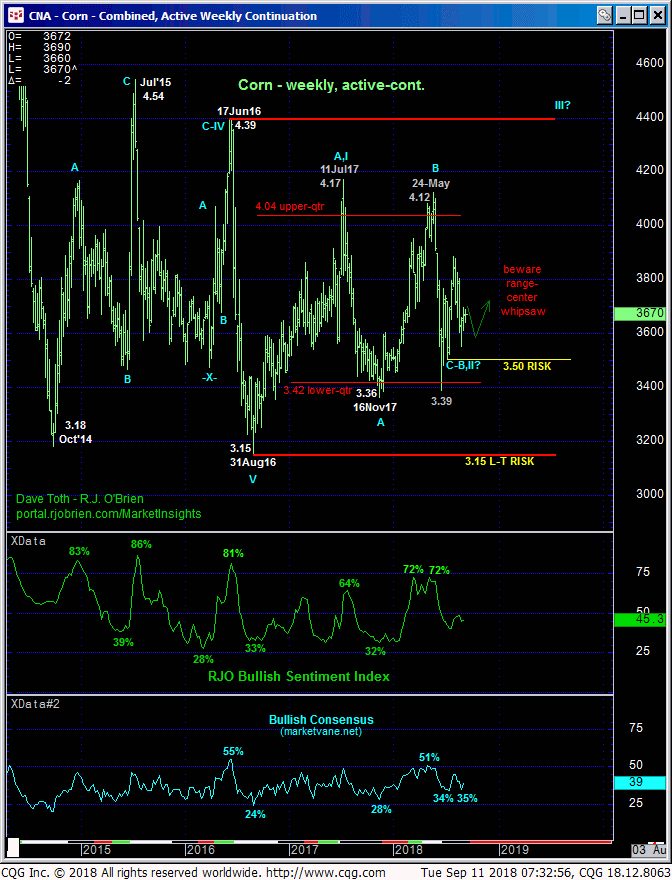
This said, the most blatant fact of the technical matter shown in the hourly, daily and weekly charts below is that the market remains trapped within the middle-half bowels of the past 2-1/2-months’ range as well as the middle of the middle-half of an incessant FOUR YEAR range. Heading into tomorrow’s key crop reports, flip a coin. By the end of the day tomorrow this market could be 20-cents either way. In the analysis below we offer cautious but favorable risk/reward option strategies for both spec and hedge purposes.
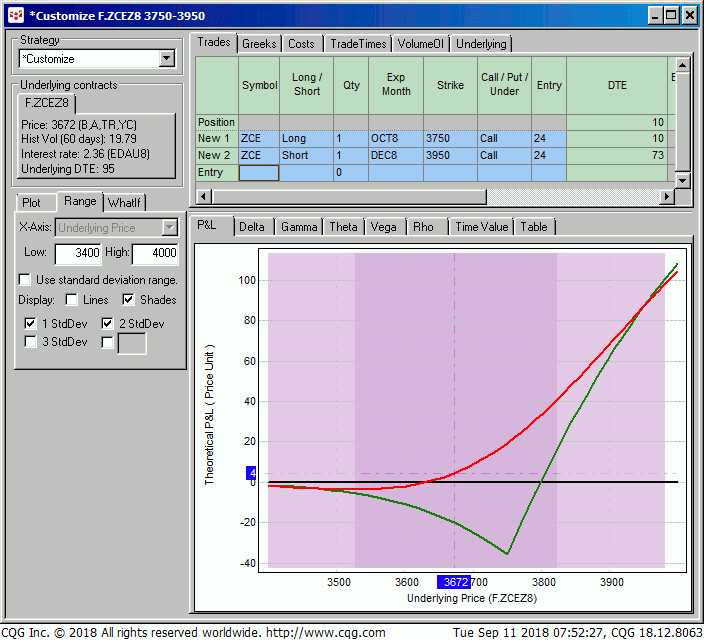
BULL SPEC: OCT 3.75 / DEC 3.95 CALL DIAGONAL
This diagonal spread involves buying 1-unit of the Oct 3.75 calls for around 2-1/2-cents and selling 1-unit of the Dec 3.95 calls around 2-1/2-cents for a net cost of “even”. This strategy provides:
- a current net delta of +0.13
- 2.5:1 gamma ratio
- negligible risk if the underlying Dec contract collapses
- profit potential of up to 20-cents if the Dec contract sustains a sharp rally above 3.95.
As always with long-gamma diagonal strategies, this gamma advantage comes in exchange for time decay risk, or theta, as the front-month Oct options expire in 10 days on 9/21 while the deferred-month Dec options don’t expire for 73 days on 11/23. Mere lateral, flat-line price action is the worst enemy of diagonal spreads as the long option risks expiring worthless, leaving a potential naked short position in the Dec calls that could ultimately expose infinite risk if the uptrend resumes after the Oct calls expire. But we never let the position get to that point, opting to cover the position for a small loss over the course of the next week if the market doesn’t move sharply one way or the other.
Profit & Loss Bull Spec Chart
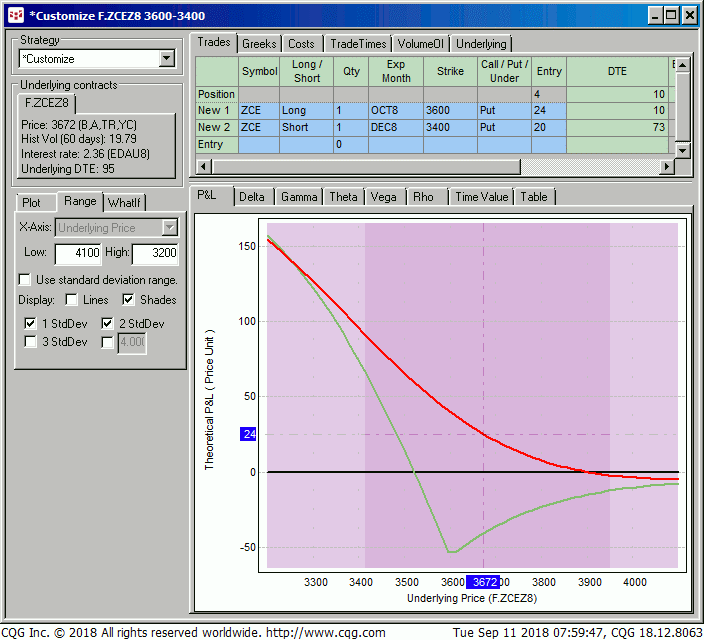
BEAR SPEC: OCT 3.60 / DEC 3.40 PUT DIAGONAL
This diagonal spread involves buying 1-unit of the Oct 3.60 puts for around 2-1/2-cents and selling 1-unit of the Dec 3.40 puts around 2-cents for a net cost of about 1/2-cent and provides:
- a current net delta of -0.18
- 2:1 gamma ratio
- negligible risk if the underlying Dec contract rallies sharply
- profit potential of up to 19-1/2-cents if the Dec contract sustains a sharp move lower below 3.40.
Here too, the gamma advantage comes in exchange for time decay risk, or theta, as the front-month Oct options expire in 10 days on 9/21 while the deferred-month Dec options don’t expire for 73 days on 11/23. Mere lateral, flat-line price action is the worst enemy of diagonal spreads as the long option risks expiring worthless, leaving a potential naked short position in the Dec puts that could ultimately expose infinite risk if the downtrend resumes after the Oct options expire. But we never let the position get to that point, opting to cover the position for a small loss over the course of the next week if the market doesn’t move sharply one way or the other.
Profit & Loss Bear Spec Chart
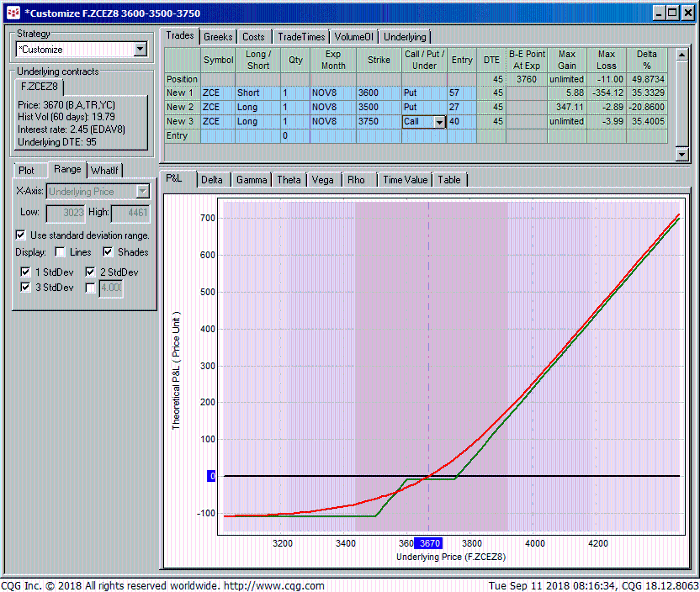
BULL HEDGE: SHORT NOV 3.60/3.50 PUT SPREAD – LONG NOV 3.75 CALL COMBO
This strategy involves selling the Nov 3.60 – 3.50 put spread for around 3-cents and buying the Nov 3.75 calls around 4-cents for a net cost of a penny. This strategy provides:
- a current net delta of +0.50
- favorable margins
- max risk/cost of 1-cent if the underlying Dec contract settles anywhere between 3.60 and 3.75 a expiration 45 days from now on 10.26
- fixed, maximum risk/cost of 11-cents on ANY decline below 3.50
- unlimited, dollar-for-dollar upside hedge protection above its 3.76 breakeven at expiration.
Profit & Loss Bull Hedge Chart
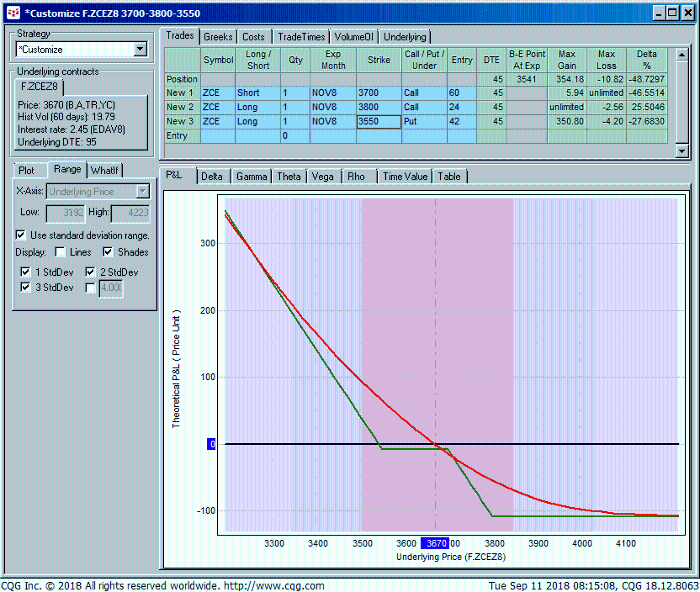
BEAR HEDGE: SHORT NOV 3.70/3.80 CALL SPREAD – LONG NOV 3.55 PUT COMBO
This strategy involves selling the Nov 3.70 – 3.80 call spread for around 3-1/2-cents and buying the Nov 3.55 puts around 4-1/4-cents for a net cost of a penny. This strategy provides:
- a current net delta of -0.48
- favorable margins
- max risk/cost of 1-cent if the underlying Dec contract settles anywhere between 3.55 and 3.70 a expiration 45 days from now on 10.26
- fixed, maximum risk/cost of 11-cents on ANY rally above 3.80
- virtually unlimited, dollar-for-dollar downside hedge protection below its 3.54 breakeven at expiration.
Please contact your RJO representative for updated bid/offer quotes on these strategies.
Profit & Loss Bear Hedge Chart
