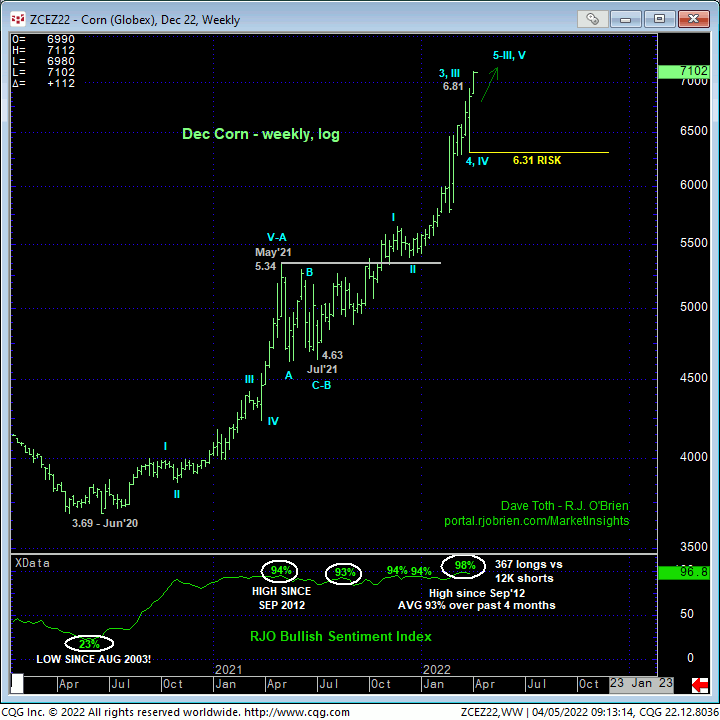
DEC CORN
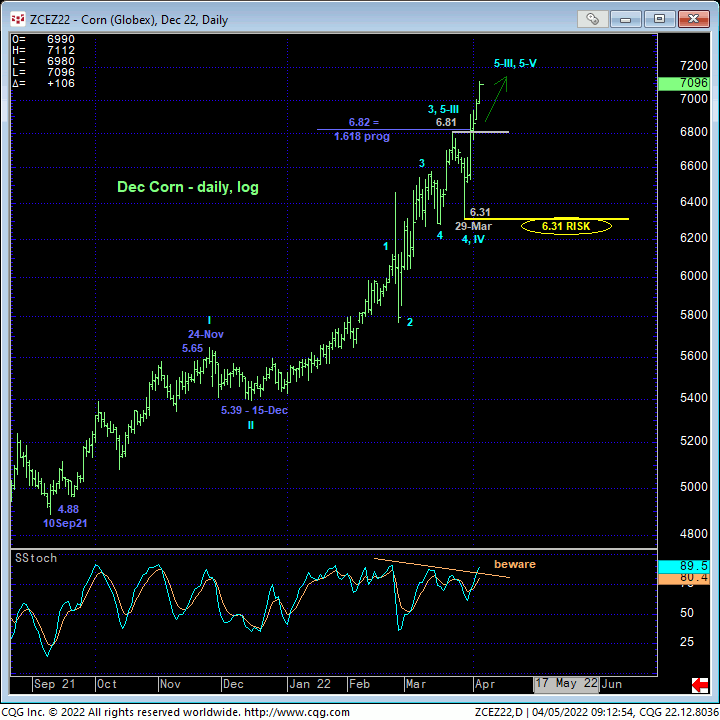
This week’s continued, arguably accelerating gains reinforce a bullish count and leave 29-Mar’s 6.31 low in its wake as the latest larger-degree corrective low this market is now required to fail below to confirm a bearish divergence in momentum of a scale sufficient to threaten or break the secular bull trend. Per such, this level serves as our new long-term risk parameter from which longer-term commercial players can objectively rebase and manage the risk of a still-advised bullish policy and exposure. End-users need to maintain bull hedges while producers still require a bearish divergence in even SHORT-TERM momentum to even begin to think about protecting downside.
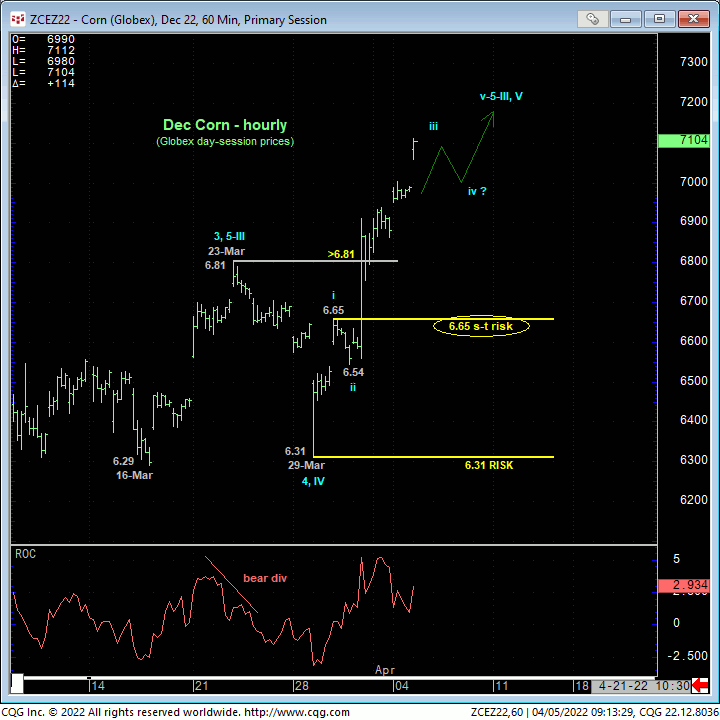
Even on a short-term basis, the hourly chart below show the bull accelerating higher. Of just this resumed bull trend from last week’s 6.31 low, 30-Mar’s 6.65 high is considered the minor 1st-Wave high of an eventual 5-wave sequence up and the closest bull risk parameter we can identify on this smaller scale. We strongly suspect at least another interim (4th-Wave) corrective hiccup back down ahead of a (5th-Wave) resumption of the bull before even the POTENTIAL for a bearish divergence in momentum is presented. And even then, the market would be required to CONFIRM the signal by failing below that smaller-degree 4th-Wave corrective low. Until and unless these minimum requirements are satisfied OR the market fails below 6.65, the trend remains up on all scales and should not surprise by its continuance or acceleration.
In sum, a full and aggressive bullish policy and exposure remain advised with a failure below 6.65 minimally required for shorter-term traders to step aside and commensurately larger-degree weakness below 6.31 for longer-term commercial players to follow suit.
MAY CORN
The hourly chart below shows that the May contract has yet to recoup 23-Mar’s 7.71 high and our short-term risk parameter needed to confirm Mar’s sell-off attempt as a 3-wave and thus corrective affair consistent with a still-unfolding major bullish count and bull market. Given the extent of the market’s recovery following 29-Mar’s bearish divergence in short-term momentum below 7.26 however, the sell-off attempt from 04-Mar’s 7.83 high to 29-Mar’s 7.13 low looks about as 3-wavish and corrective as we can imagine. Against the backdrop of the secular bull market, we believe Mar’s mere lateral chop IS just another correction ahead of a resumption of the secular bull. Per such, we’re identifying last week’s 7.13 low as our new long-term bull risk parameter pertinent to longer-term commercial players.
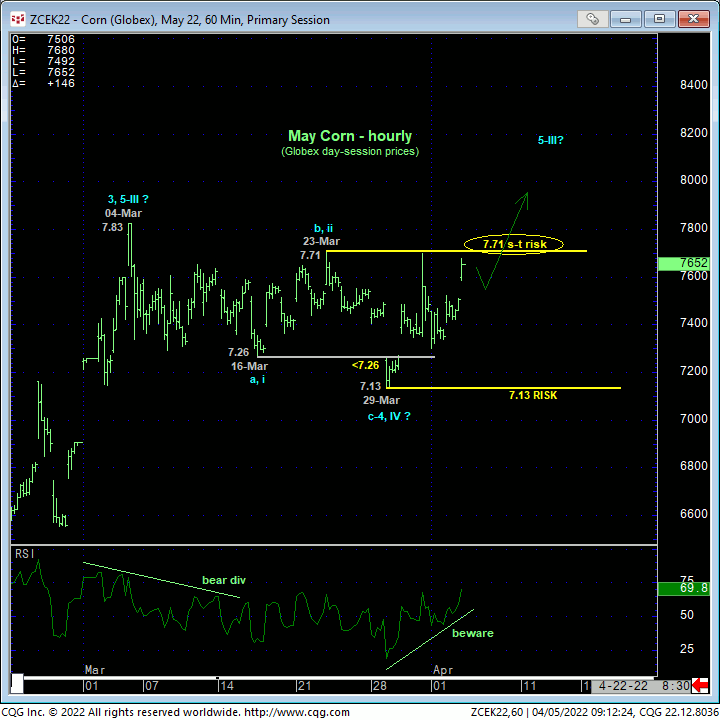
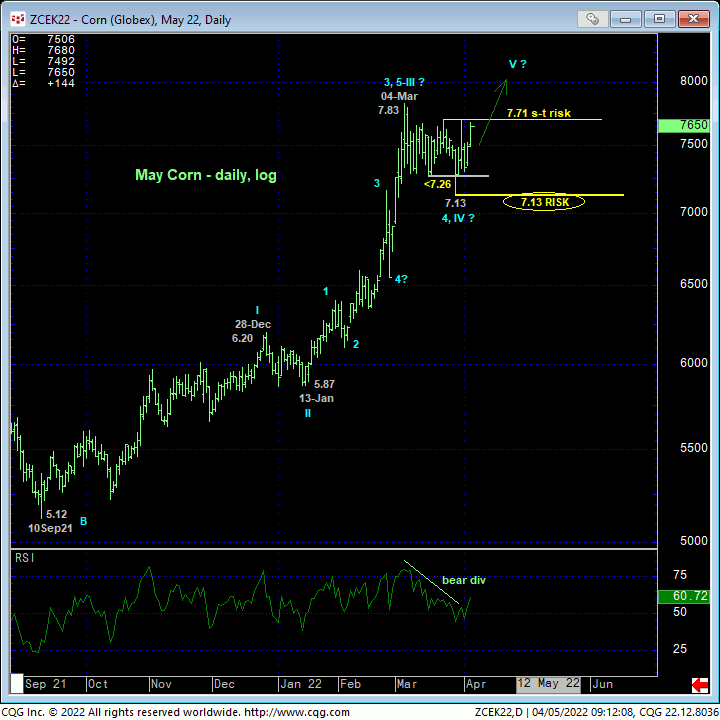
Stepping back to considered the extent and accelerated manner of the portion of the secular bull from 13-Jan’s 5.87 low, it’s much easier to see the likelihood that the past month’s meager sell-off attempt is merely a corrective, consolidative bull-flag structure that warns of a resumption of the secular bull trend that preceded it. If this call is wrong, all the bear’s got to do is break 7.13. Until such weakness is proven, further and possibly steep gains are anticipated.
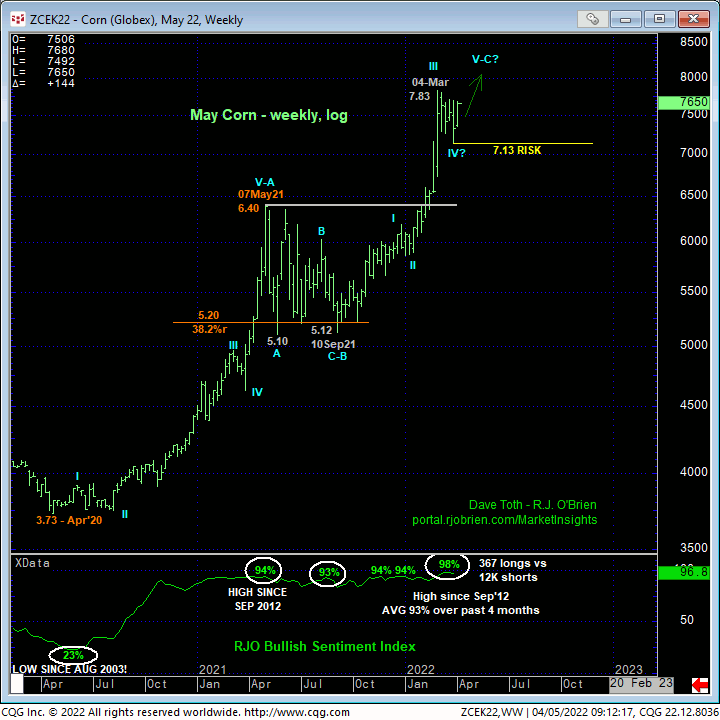
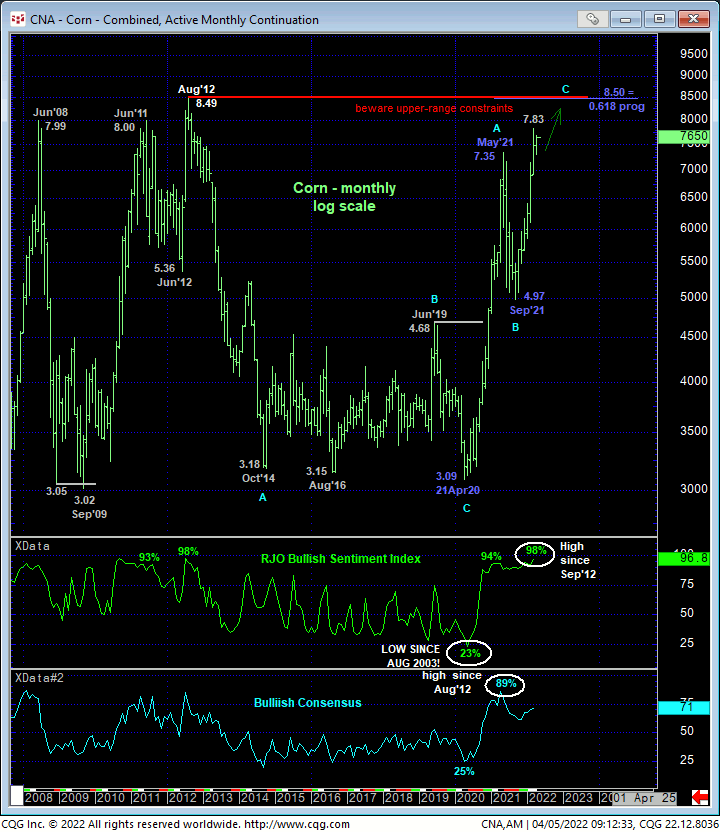
So after all this, where does this market think it’s going to the upside??? Of course, the answer is there’s no way to know. It’s interesting to note that the resumed bull from last Sep’s 4.97 low will span a distance 61.8% (i.e. 0.618 progression) of Apr’20 – May’21’s 3.09-to-7.35 preceding rally at 8.50, right around 2012’s 8.49 all-time high. Of course, this merely derived Fibonacci level and relationships means absolutely nothing without an accompanying confirmed bearish divergence in momentum. But this gives us something to think about if/when the market rallies to that area.
In sum, a bullish policy remains advised for longer-term players with a failure below 7.13 required to threaten this call enough to warrant moving to a neutral/sideline/bear-hedge position. Shorter-term traders with tighter risk profiles advised to neutralize longs on last week’s failure below 7.26 are advised to return to a bullish policy and exposure on the immediate recovery above 7.71 with a subsequent failure below 7.13 required to negate this call and warrant its cover. We will also be watchful for a return to the lower-quarter of the recent 7.83 – 7.13-range (around 7.30) for a preferred risk/reward buying opportunity for shorter-term traders with a failure below 7.13 required to negate that call and warrant its cover.