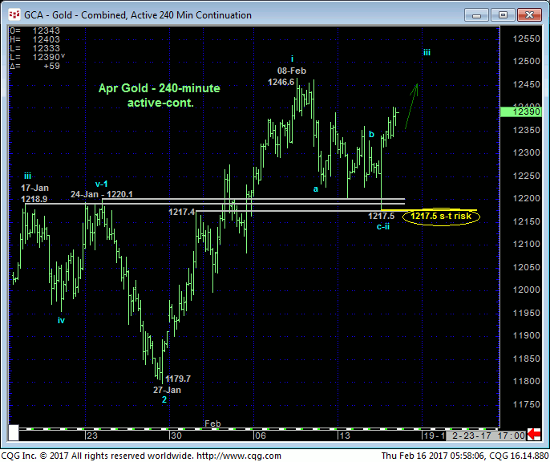
In 07-Feb’s Technical Blog we identified a key area of former resistance from the second-half of Jan between 1220 and 1217 that, since broken, should now serve as a key new support candidate if our broader bullish count was correct. As a result of yesterday and overnight’s rebound the 240-min chart below shows that this area held perfectly and exposes yesterdays 1217.5 low as the end or lower boundary of a corrective/consolidative sell-off attempt from last week’s 1246.6 high consistent with our broader bullish count. As a result we are identifying 1217.5 as our new short-term risk parameter this market is now minimally required to fail below to defer or threaten a more immediate bullish count.


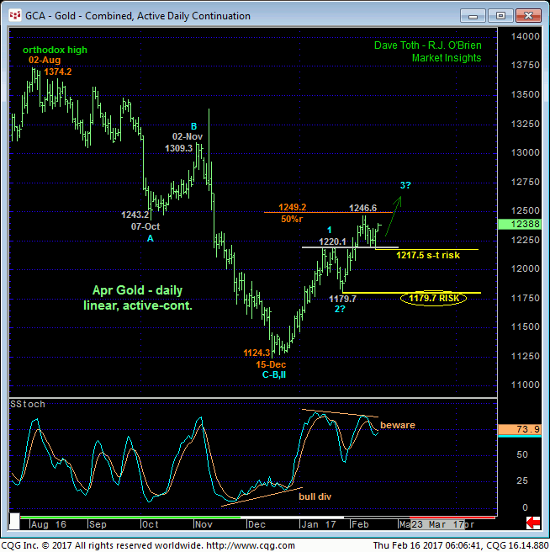
The daily chart above shows the developing POTENTIAL for a bearish divergence in momentum, but minimum weakness below at least yesterday’s 1217.5 smaller-degree corrective low is required to threaten the 2-month uptrend to the point of non-bullish action like long-covers. And even sub-1217.5 weakness would only allow us to conclude the end of the uptrend from 27-Jan’s 1179.7 larger-degree corrective low and key risk parameter, NOT the broader 2-month bull. This tighter but objective risk parameter at 1217.5 may come in handy as the market engages the 50% retracement area of the declines from either 02Aug16’s orthodox high of 1374.2 or 06Jul16’s 1377.5 absolute high.
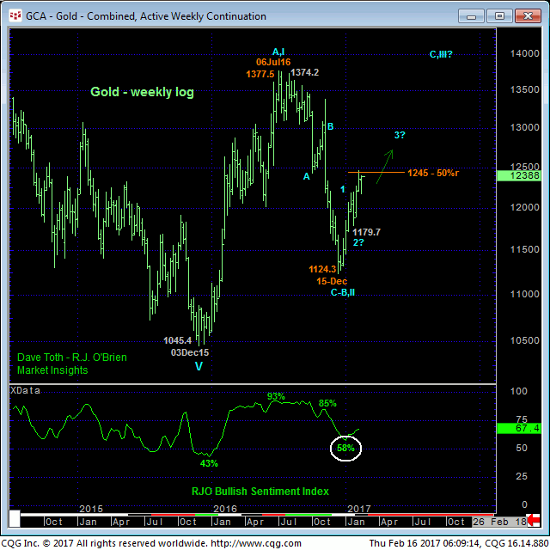
Market sentiment according to our RJO Bullish Sentiment Index of the hot Managed Money positions reportable to the CFTC is benign at best and won’t inhibit a big move in either direction. But traders are reminded that that direction could still be UP in a huge way per what we believe is a major basing process from Dec’15’s 1045 low that calls for the reversal of the secular bear market from 2011’s all-time high of 1923. If correct this count calls the rally from 15Dec16’s 1124.3 low the (C- or 3rd-Wave) resumption of 2016’s rally to eventual new highs above 1378, a resumption that could “take off” above the 1250-area.
These issues considered, a full and aggressive bullish policy and exposure remain advised with weakness below at least 1217.5 and preferably 1179.7 required to threaten this call and warrant paring or neutralizing bullish exposure. In lieu of such weakness further and possibly accelerated gains remain anticipated straight away.


