Posted on Aug 17, 2023, 06:32 by Dave Toth
In 10-Aug’s Technical Blog we discussed the prospect that 03-Aug’s 83.25 low completed a 3-wave correction down from 27-Jul’s 88.39 high that warned of a resumption of the trendy, impulsive 5-wave rally from 27-Jun’s 76.81 low to at least one more round of (5th-Wave) new highs above 88.39. Mission accomplished. Or maybe not.
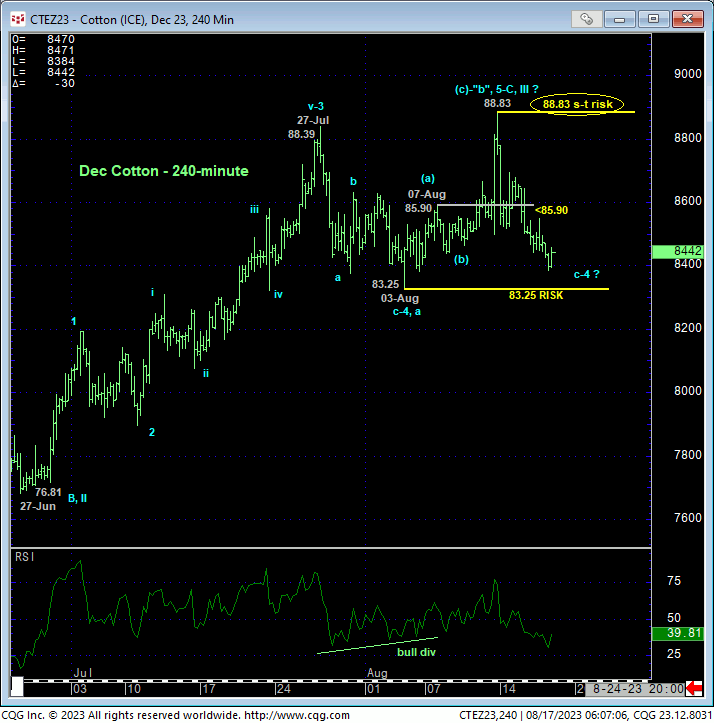
By virtue of the market’s gross failure to sustain 11-Aug’s “breakout” above 88.39, and subsequent relapse below a minor initial high at 85.90 from 07-Aug, the resumed rally from 03-Aug’s 83.25 low is clearly only a 3-wave structure as labeled in the 240-min chart below. We don’t want to ignore the possibility that maybe last week’s 88.83 high might have completed the 5th-Wave of the sequence up from 76.81, and in this short-term regard that 88.83 high serves as an objective short-term parameter from which shorter-term traders can objectively base non-bullish decisions like long-covers. But there are plenty of Elliott purists out there rolling their eyes at this count.
What we believe may be unfolding is the prospect that early-Aug’s rally from 83.25 to 88.83 is just the b-Wave “irregular” of the correction that began from 27-Jul’s 88.39 high, with the current relapse being the completing c-Wave that may or may not hold up above 03-Aug’s 83.25 low. And regardless of all this Elliott mumbo-jumbo, a failure below 83.25 warrants neutralizing bullish exposure due to what will be a confirmed bearish divergence in DAILY momentum that will, in fact, break Jun-Aug’s broader uptrend.
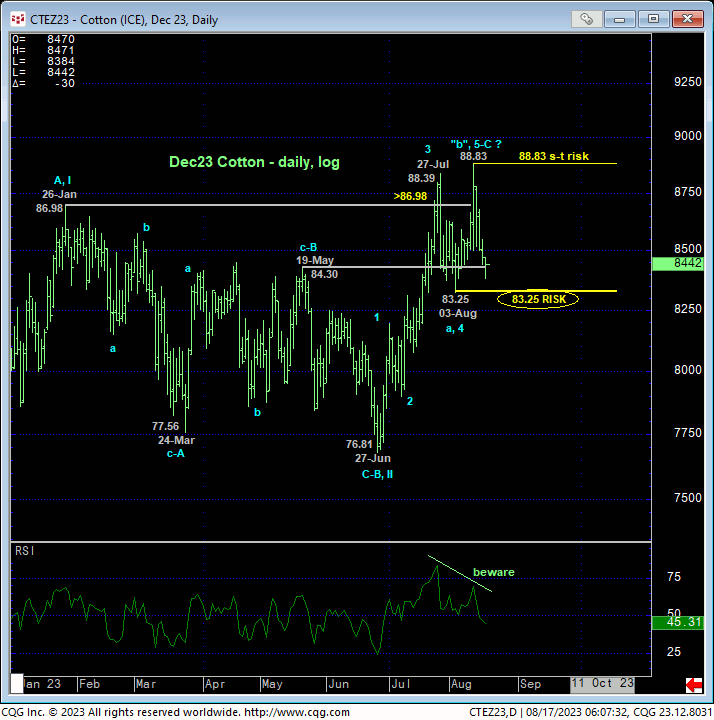
One thing is for sure as a result of the past week’s relapse: last week’s 88.83 high is THE level this market now must recoup to resurrect a longer-term bullish count. Until and unless this high is taken out, the not uncommon debate is on as to whether the past few weeks’ non-trending behavior is that of a mere correction ahead of the eventual resumption of the broader bull OR that of a broader peak/reversal process. Effectively navigating this challenge centers around the key directional flexion points at 88.83 and 83.25.


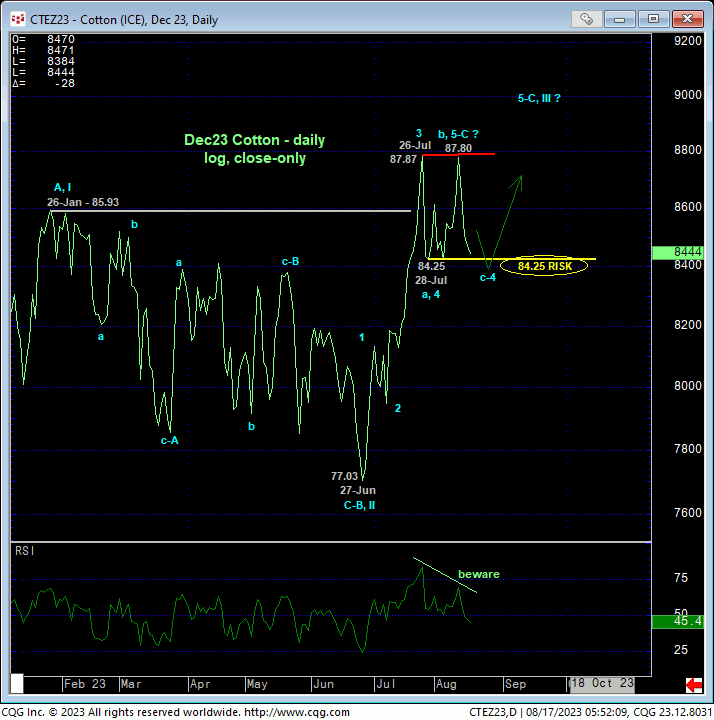
Both the daily log high-low chart above and close-only chart below show the nicely developing potential for a bearish divergence in momentum. An intra-day break below 83.25 and/or a close below 28-Jul’s 84.25 low close will CONFIRM the divergence to the point of non-bullish action like long-covers by longer-term traders. And per the bull market correction count detailed above, it’s interesting to note in the close-only chart below that last week’s 11-Aug high of 87.80 failed to take out 26-Jul’s 87.87 high.
Nonetheless, a close below 84.25 and/or an intra-day break below 83.25 will confirm a momentum failure and leave this market exposed to indeterminable losses thereafter. Might such a failure be the completing c-Wave of the correction? Absolutely. And if this is what unfolds, traders will be exposed to whipsaw risk. But from a technical discipline standpoint, whipsaw risk is the conservative risk preference to betting against what then would be a downtrend threat and “hoping” for the market to recover.
If the market breaks 83.25, traders are advised to neutralize all bullish exposure to circumvent indeterminable downside thereafter. IF that break is the completing c-Wave to the correction, by definition the market will arrest that break with a countering bullish divergence in short-term mo and reject/define a more reliable low and support from which the risk of a resumed bullish position can only then be objectively rebased and managed.

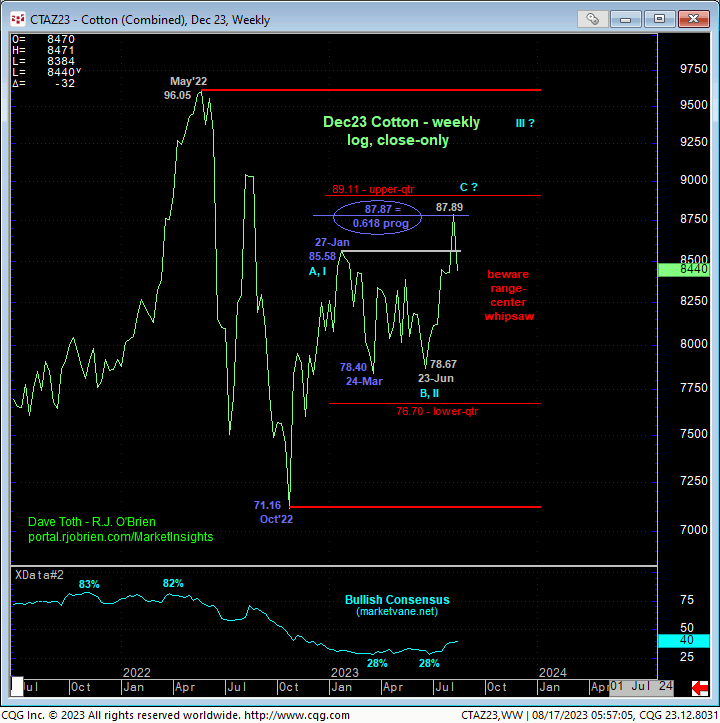
Lastly, the weekly log close-only chart of the Dec contract shows the resumption of Oct’22 – Jan’23’s uptrend. On this basis, it’s also interesting to point out that the resumed rally from this year’s 24-Mar’s 78.40 low came within two ticks of the (87.87) 0.618 progression of Oct-Jan’s preceding rally from 71.16 to 85.58. COMBINED with a mo failure below 83.25 as well as what would be the market’s gross failure to sustain this month’s “breakout” above multi-month highs and resistance, traders are advised to not underestimate the market’s downside potential IF the market fails below 83.25.
These issues considered, a bullish policy and exposure remain advised with a failure below 83.25 or a close below 84.25 required to move to a neutral/sideline position.


