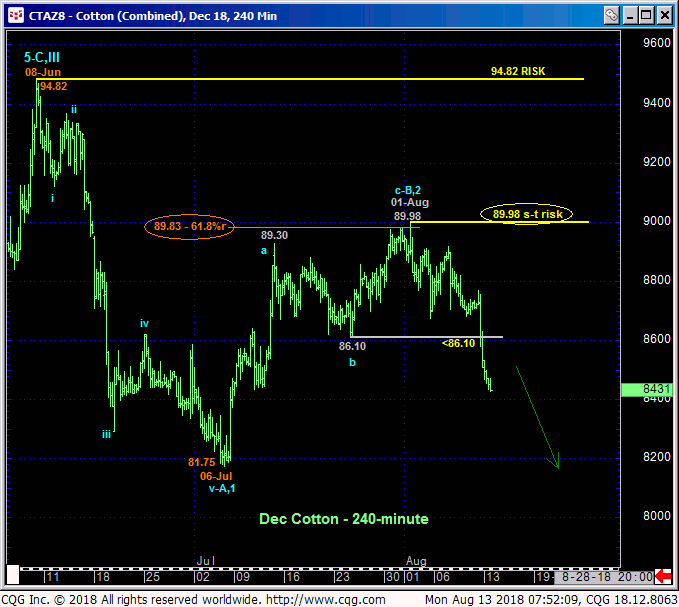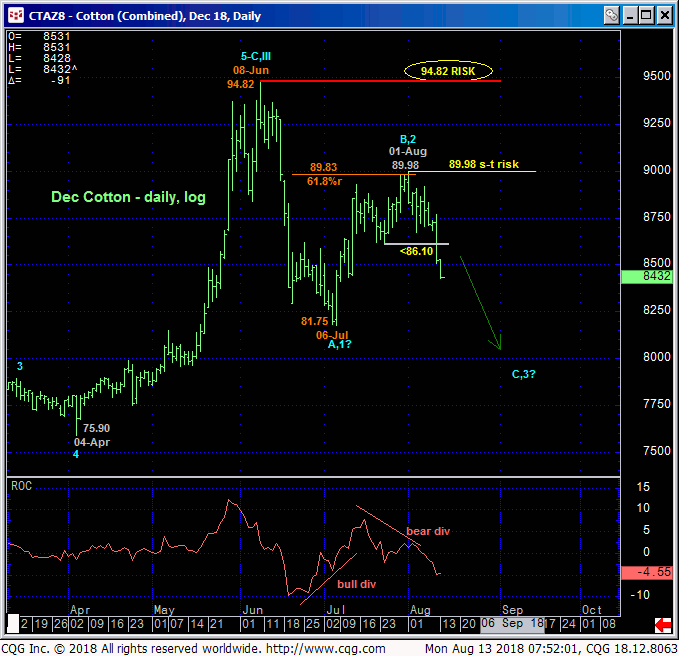
The market’s failure Fri below 24-Jul’s 86.10 corrective low and short-term but key risk parameter discussed in 30-Jul’s Technical Blog confirms a bearish divergence in momentum that defines 01-Aug’s 89.98 as the END of the recovery from 06-Jul’s 81.75 low. Given the 3-wave sub-division of this recovery and Fibonacci fact that it stemmed from the (89.82) 61.8% retrace of Jun-Jul’s initial 94.82 – 81.75 decline, odds have increased that 01-Aug’s 89.98 is the B- or 2nd-Wave correction ahead of a suspected (C- or 3rd-Wave) resumption of Jun-Jul’s downtrend that preceded it. In this regard 89.98 is considered our new short-term risk parameter from which non-bullish decisions like long-covers and a resumed bearish policy by shorter-term traders can be objectively based and managed.


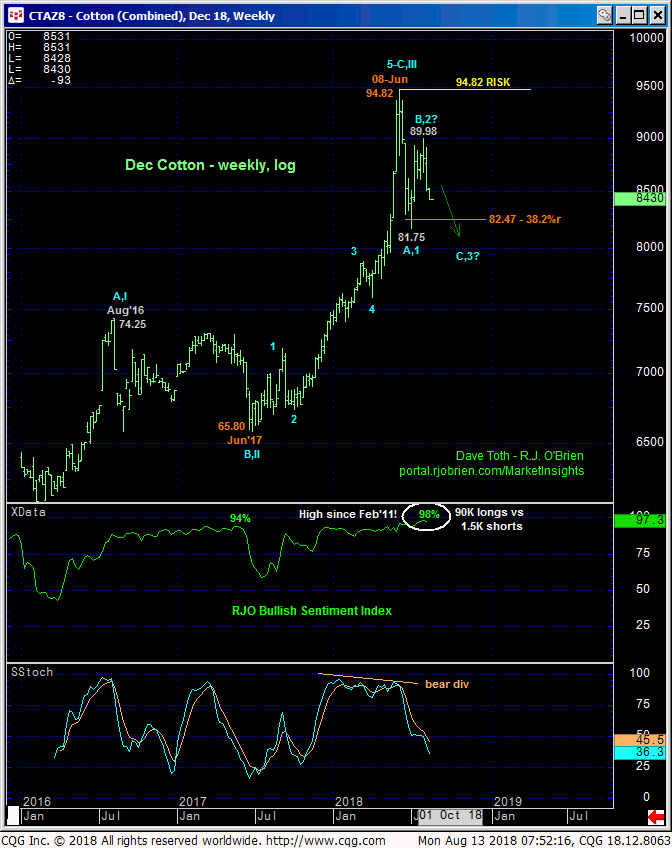
From a longer-term perspective the past couple days’ relapse is consistent with a major peak/correction/reversal threat we introduced in 18-Jun’s Technical Blog that contended 08-Jun’s 94.82 high ENDED a 5-wave rally from Jun’17’s 65.80 low ahead of a major correction or reversal of that year-long rally. Historically frothy sentiment then AND STILL would seem to reinforce this peak/reversal threat that could be major in scope, warning of a resumption of Jun-Jul’s decline to levels potentially well below 06-Jul’s 81.75 low.
These issues considered, long-term players remain advised to maintain a bearish policy with strength above 89.98 required to pare exposure to more conservative levels and commensurately larger-degree strength above 94.82 required to negate the call altogether and warrant its cover. Shorter-term traders are advised to return to a bearish policy and first approach recovery attempts to the 86.10-area of former support-turned-resistance as corrective selling opportunities with a recovery above 89.98 required to negate this call and warrant its cover. In lieu of strength above at least 89.98, we anticipate further and possibly protracted losses straight away.


