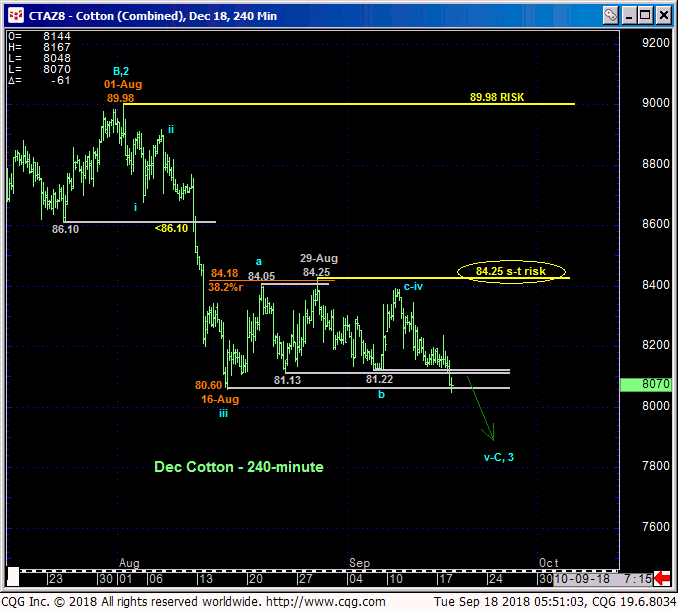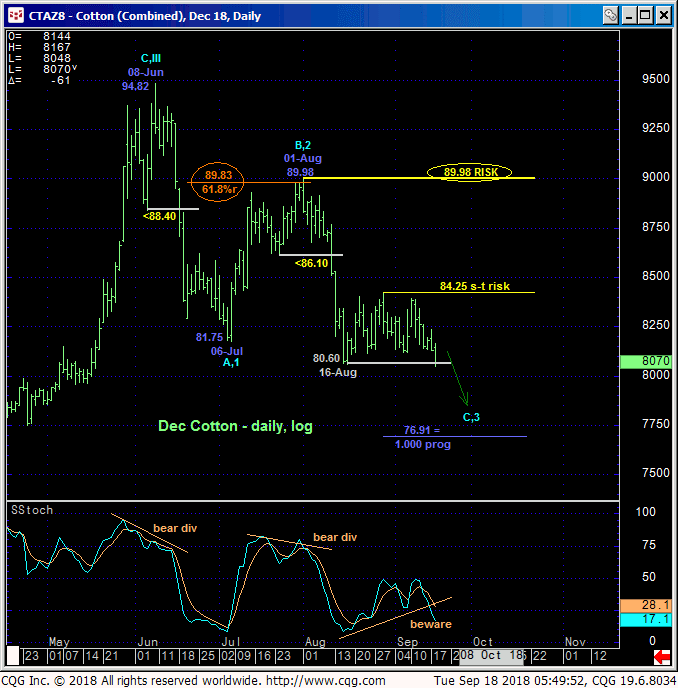
This morning’s break below the past month’s 80.60-to-81.22-range support reaffirms our broader peak/reversal count introduced exactly three months ago in 18-Jun’s Technical Blog and reinforced in 13-Aug’s Technical Blog following 10-Aug’s bearish divergence in momentum that marked the end of Jul’s corrective rebound within the broader peak/reversal process. This resumed weakness reaffirms 29-Aug’s 84.25 high as the upper boundary to what clearly is a corrective/consolidative lateral structure stemming from 16-Aug’s 80.60 low that warned of an eventual resumption of the downtrend that preceded it. Per such that 84.25 high remains intact as a relatively tight but key risk parameter to a still-advised bearish policy and exposure.
Former 80.60-to-81.22-range support, since broken, is now expected to hold as near-term resistance.


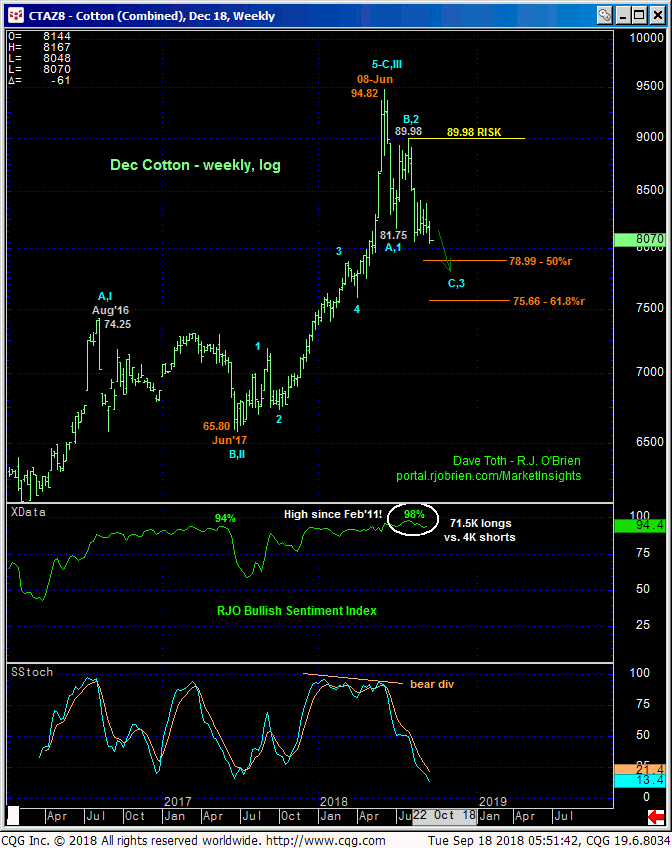
Both the daily (above) and weekly (below) log scale charts show today’s resumption and reaffirmation of a developing downtrend that’s now got more than three months of peak/reversal behavior behind it. And almost shockingly, the historically frothy levels in our RJO Bullish Sentiment Index of the hot Managed Money positions reportable to the CFTC hat contributed to this peak/reversal count more than three months ago REMAINS extreme at 94% DESPITE three months of price erosion. Given the magnitude and uninterrupted manner of Jun’17 – Jun’18’s rally that left no former battlegrounds that can now be looked to as support candidate now that that 80.60 low and support has been broken, we believe this market may now be prone to sharp, even relentless losses straight away as the overall market forces the capitulation of these stubbornly long-&-wrong positions.
These issues considered, a full and aggressive bearish policy and exposure remain advised with strength above 84.25 required to threaten this count enough to warrant its cover. In lieu of such 84.25+ strength we anticipate further and possibly severe losses straight away that could span months as there’s no support below the market. The only levels of any technical merit currently lie ABOVE the market in the forms of former support-turned-resistance from the 80.60-to-81.22-range and prior corrective highs like 84.25.


