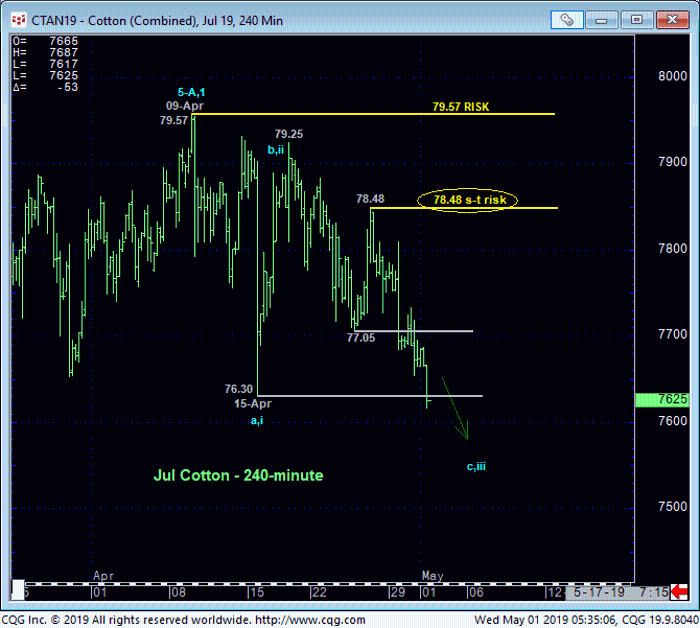
The market’s break today’s below 15-Apr’s 76.30 low reaffirms our peak/correction count introduced in 15-Apr’s Technical Blog following that day’s bearish divergence in momentum below 28-Mar’s 76.53 corrective low that broke Feb-Apr’s uptrend. This resumed weakness leaves 25-Apr’s 78.48 high in its wake as the latest smaller-degree corrective high this market is now required to recoup to stem the relapse and render the sell-off attempt from 09-Apr’s 79.57 high the 3-wave and thus corrective structure we believe it to be.
Until and unless the market stems the clear and present intermediate-term downtrend with such a mo failure, the extent of this relapse is indeterminable and should not be underestimated. In this regard that 78.48 high becomes our new short-term risk parameter from which any non-bullish decisions like long-covers and interim bearish punts can be objectively rebased and managed by shorter-term traders with tighter risk profiles.


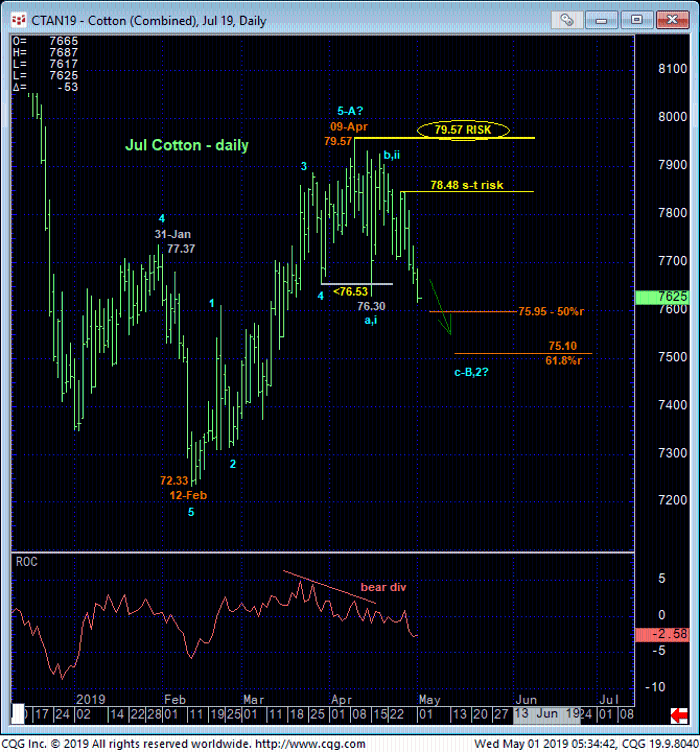
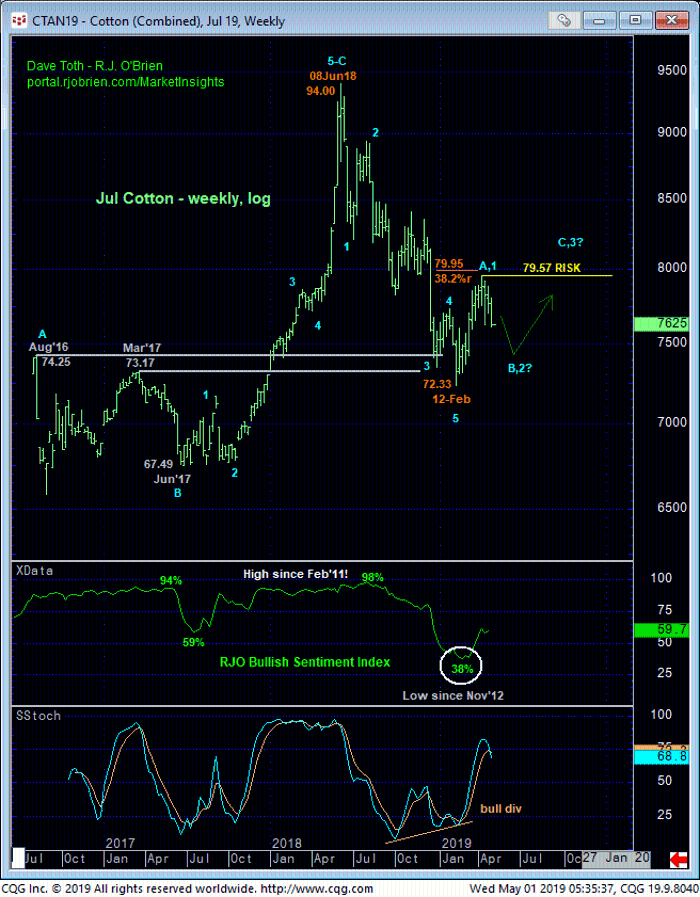
The daily chart above shows the textbook 5-wave Elliott sequence up from 12-Feb’s 72.33 low broken by 15-Apr’s bearish divergence in momentum below 76.53. On the heels of Jun’18 – Feb’19’s major 94.00 – 72.33 decline, we believe the extent and impulsiveness of Feb-Apr’s rally warns that this rally is just the initial (A- or 1st-Wave) counter-trend move of a major correction or reversal lateral-to-higher that could span months or even quarters. Against this backdrop the current relapse would then be expected to be just a (B- or 2nd-Wave) corrective subset within this broader base/correction/reversal PROCESS.
This said, traders must acknowledge 1) the indeterminable depth of this correction and 2) the prospect that this entire count is wrong and that the market is poised to resume Jun’18 – Feb’19’s crash-&-burn to new lows below 72.33. What we know with specificity is what the market has to do to negate any broader bearish counts, reinforce our bull market correction count and expose a resumption of Feb-Apr’s rally: recover above at least 78.48 and certainly 09-Ar’s 79.57 high and key risk parameter.
The next thing to watch for with respect to a bull market correction count and a favorable risk/reward buying opportunity will be a relapse-countering bullish divergence in momentum. We’ve noted the (75.95) 50% and (75.10) 61.8% retracements of Feb-Apr’s 72.33 – 79.57 rally as “areas of interest” around which to be more watchful for such a bullish divergence in mo, but traders are urged not to place any emphasis on ANY merely derived technical level until and unless its accompanied by even the potential for a bullish divergence in momentum. And even the POTENTIAL for such a mo failure is likely to require some interim corrective rebound and another round of new lows for the current slide to set up. Per such, further and possibly accelerated losses should not surprise straight away with the formerly supportive 76-handle-area now considered new near-term resistance.

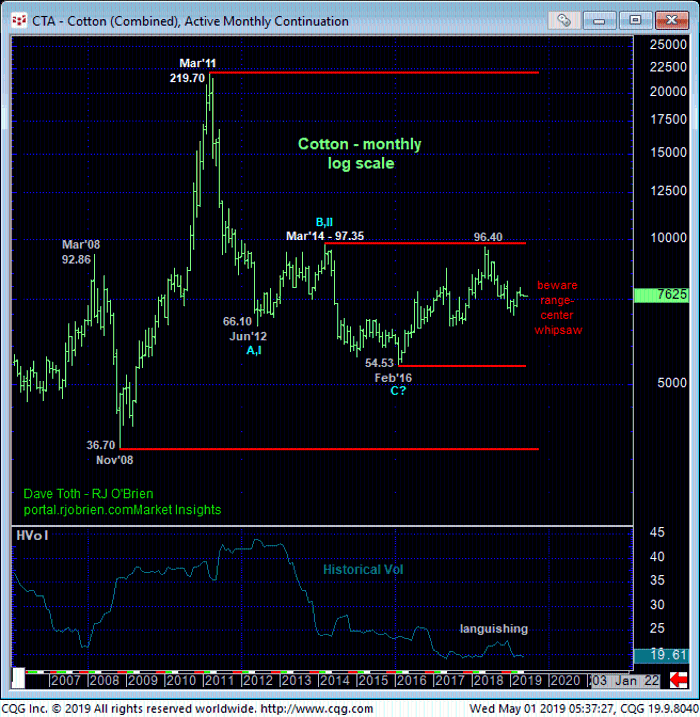
Finally, on a more historic scale, the monthly log scale chart below shows the market’s current position wafting deep within the middle-half bowels of a range that spans SEVEN YEARS amidst wallowing historical volatility. Such range-center conditions are typically rife with aimless whipsaw risk that warrants a more conservative approach to risk assumption. Odds of a big, directional move, let alone CATCHING that big, directional move, are low in our opinion.
Nonetheless and in sum, on a more practical scale discussed above we believe the market has been clear in its indication of a peak/correction/reversal environment calling for further losses in the period ahead with strength above at least 78.48 required to threaten this call. In lieu of such 78.48+ strength, an interim bearish policy and exposure remain advised. We will be watchful for a countering bullish divergence in momentum in the weeks ahead to reinforce our broader bullish count and perhaps identify a risk/reward buying opportunity that could be quite compelling.


