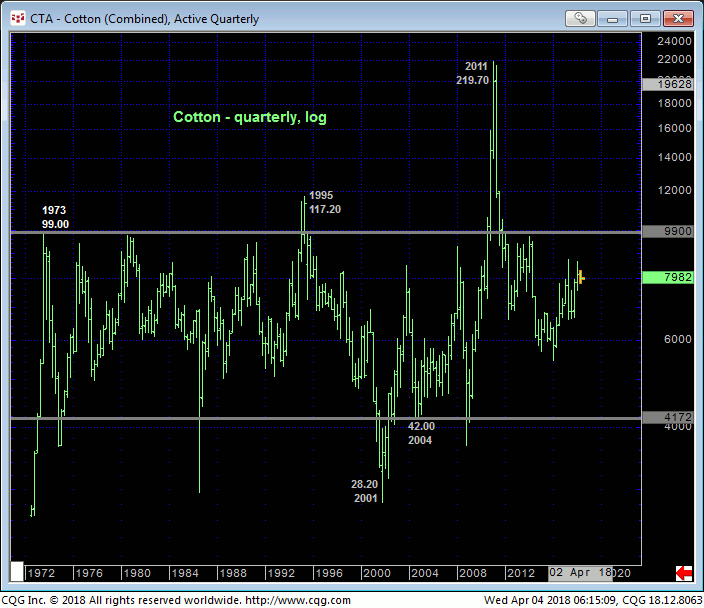
Overnight’s clear, impulsive break below the past MONTH’S worth of supporting ranging from 81.71-to-80.67 provides the next reinforcing step to a peak/reversal-threat process that could be major in scope. This resumed weakness leaves yesterday’s 82.81 high in its wake as an admittedly short-term but crucial corrective high this market is now required to sustain losses below to maintain a more immediate bearish count. In this regard 82.81 is considered our new short-term risk parameter from which all non-bullish decisions like long-covers and new bearish punts can be objectively based and managed.
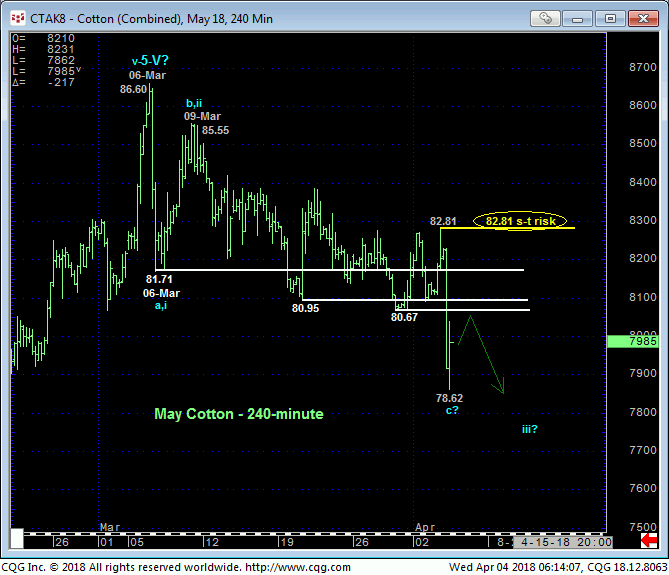
To this point the broader developing decline from 06-Mar’s 86.60 high is “only” a 3-wave affair, so we cannot ignore the ultimately-bullish possibility that today’s portion of the slide isn’t the completing c-Wave of a correction that would ultimate re-expose the 2-YEAR bull. But to resurrect such a bullish count the bull must recoup at least 82.81.
By sharp contrast and until such 82.81+ strength is shown, the current stage of the past month’s decline could be the exciting 3rd-Wave of an eventual 5-wave structure that could not only be extensive in terms of both price and time, but relentless straight away. In this broader bearish scenario former 80.67-to-81.71-area support would be expected to easily hold as key new resistance ahead of increasingly obvious and steep losses.
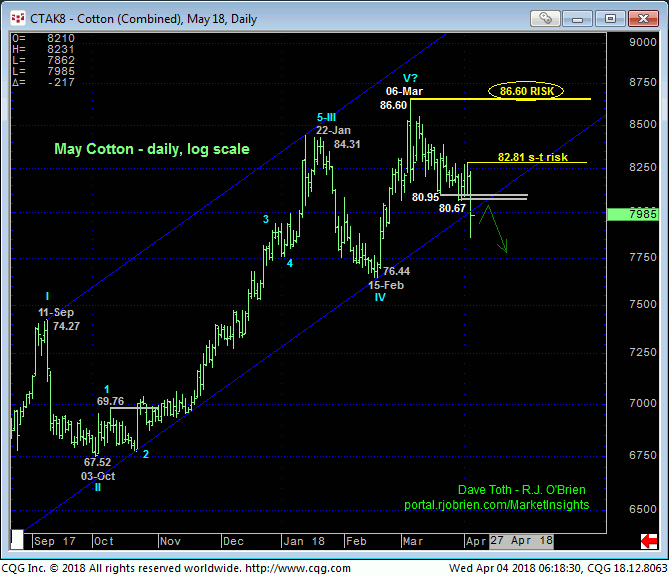
Contributing mightily to would would be a major peak/reversal count are:
- a confirmed bearish divergence in weekly momentum amidst
- still historically frothy bullish levels in our RJO Bullish Sentiment Index of the hot Managed Money positions reportable to the CFTC and
- the prospect that the entire rally from last Jun’s 66.15 low is a complete 5-wave Elliott sequence as labeled in the weekly chart below and daily chart above.
This is a unique and compelling combination of factors that, sparked by today’s resumption of at least the intermediate-term downtrend, exposes a count that warns of steep, even relentless losses straight away. The gross extent to which the Managed Money community has its neck sticking out on the bull side is now considered fuel for downside vulnerability that could be extreme.
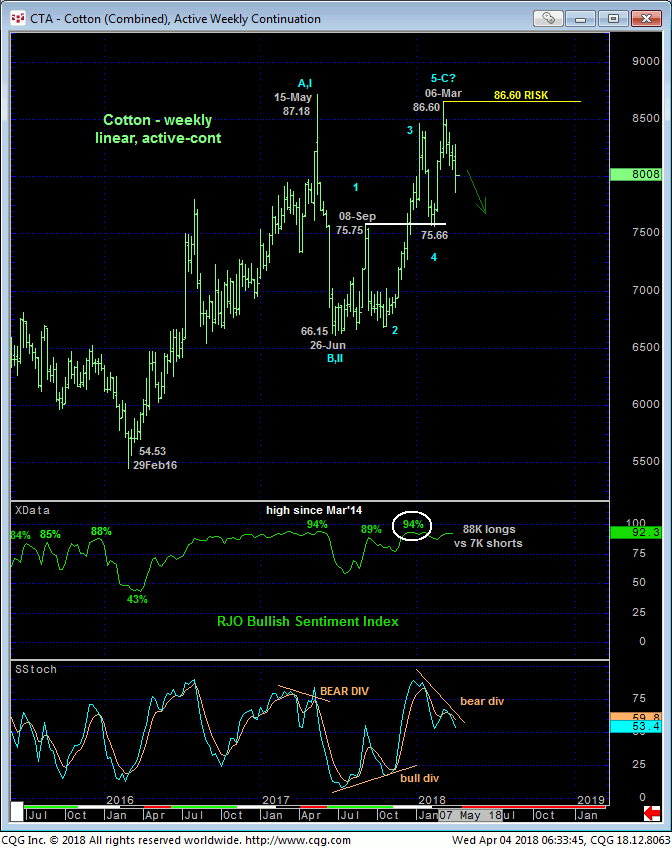
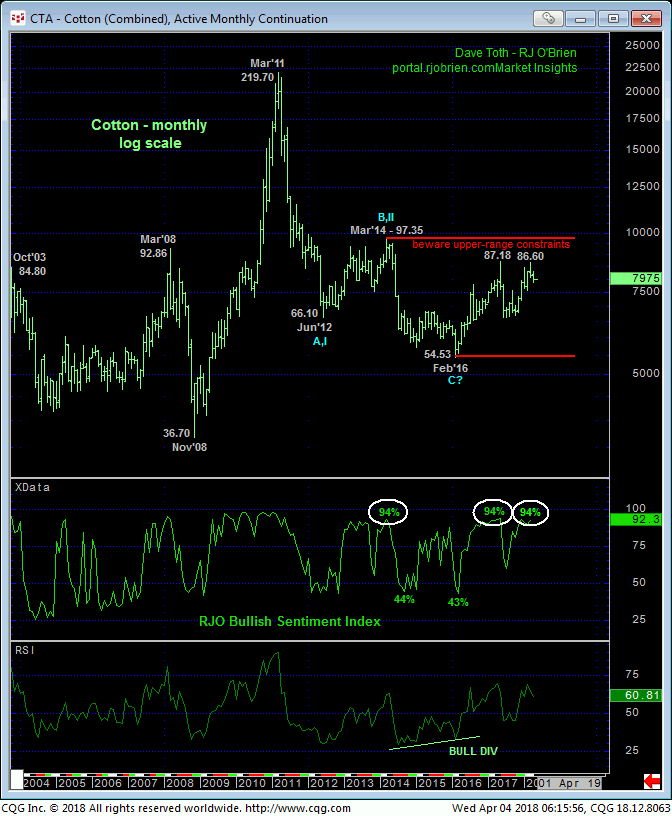
Finally, on an even longer-term basis shown in the monthly log active-continuation chart above and quarterly log chart below, the market has spent the past quarter wafting around the upper recesses of not only the past six years’ range between 55 and 97 but also that of the 42-to-99-range that houses the vast preponderance of the past 45 YEARS’ prices.
These issues considered, a bearish policy is advised for both short- and longer-term traders on a scale-up from spot (80.05) to 80.50 with strength above 82.81 required to negate this specific call and warrant its cover ahead of what then could well be a resumption of the 2-year bull. In lieu of at least such 82.81+ strength further and possibly protracted, multi-month or multi-quarter losses are anticipated straight away.
