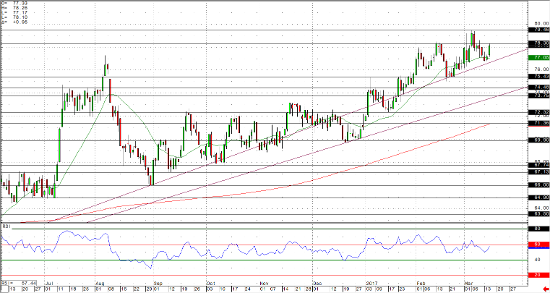
Not much of a change from our last report as cotton prices continue to grind higher. The market has been technical strong since early 2016 and recent price action continues to carve out new relative highs. Strong US exports continue to be at the forefront of this rally with the latest USDA WASDE report citing both an increase in exports along with a decrease in domestic ending stocks. Strong demand coupled with declining domestic stocks continues to support price action in the cotton market confirming the near-term bull trend.
In terms of technical structure, recent swing lows around 72.30 and 69.74 – 69.90 could be used to assess the sentiment in cotton, which will largely remain positive until the market is able to produce a close below one of these recent swing lows. Current prices remain well above the current trend line originating from the Feb 29th 2016 low and likely won’t become relevant in the near-term until the 73.75 – 74.50 area. Remember that “the trend is your friend” and has been for several months now. Traders are encouraged not to overcomplicate things in this market. To that end, contrarian participants looking for an opportunity to fade the strength in cotton would be well-served to wait for a confirmed signal of weakness before aggressively pursuing this type of strategy. So long as relative price action remains positive, the expectation is for this trend to persist over the near term. RSI remains within the 80-40 range, confirming the bullish environment and prices remain firmly above the 200-day SMA.


