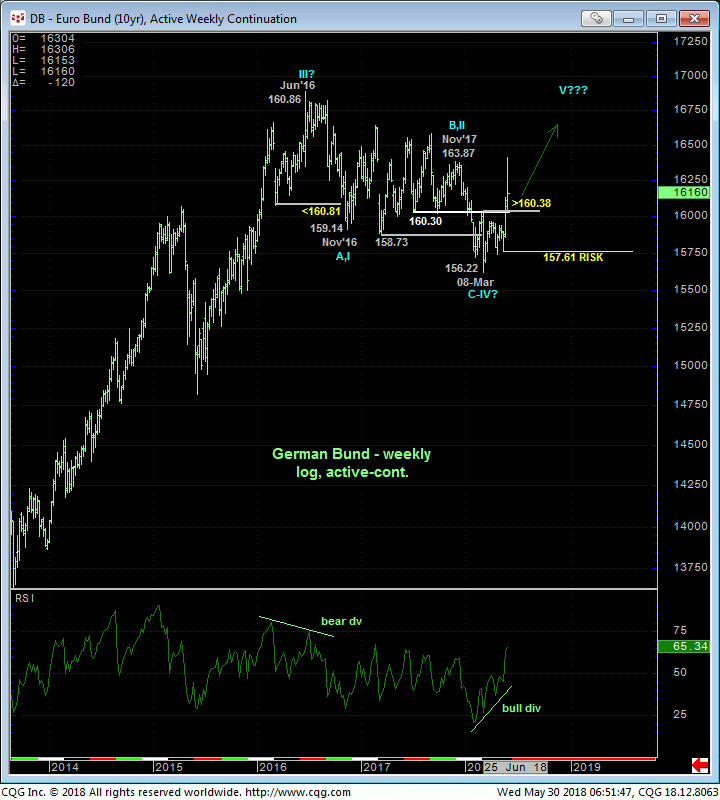
There is no question that, as a result of the past couple weeks’ impressive rally, the entire Jun’16 – Mar’18 sell-off attempt from 160.86 to 156.22 is only a 3-wave affair to this point as labeled in the weekly log active-continuation chart below. Left unaltered by a relapse below at least 15-May’s 157.61 larger-degree corrective low and key risk parameter, this 3-wave decline is arguably a corrective/consolidative event that warns of a resumption of the secular bull market that preceded it to eventual new all-time highs above 160.86.

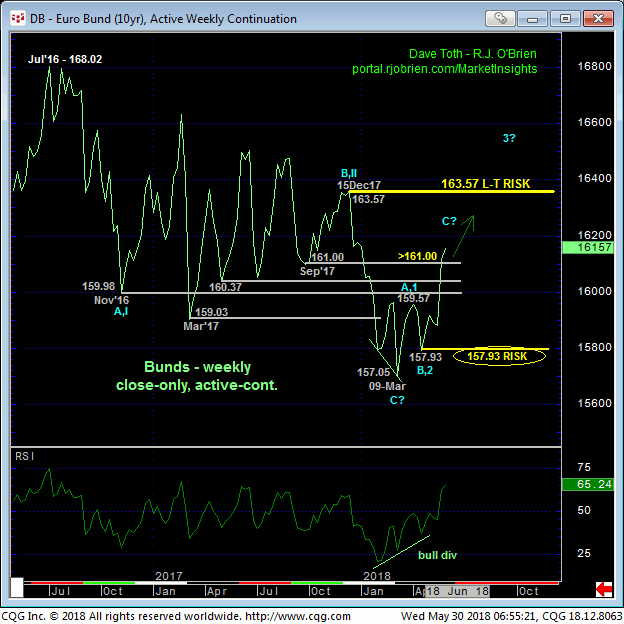
The confirmed bullish divergence in weekly momentum and the market’s failure thus far to sustain 1Q18 losses below a TON of former 159-to-161-range support that SHOULD HAVE capped as new resistance threatens the 20-month decline from Jul’16’s 168.02 high weekly close. This said, 15Dec17’s 163.57 corrective high weekly close remains as THE lone remaining hurdle this market must now recoup to confirm the 2016-18 decline as a correction and re-expose the secular bull to eventual new all-time highs.

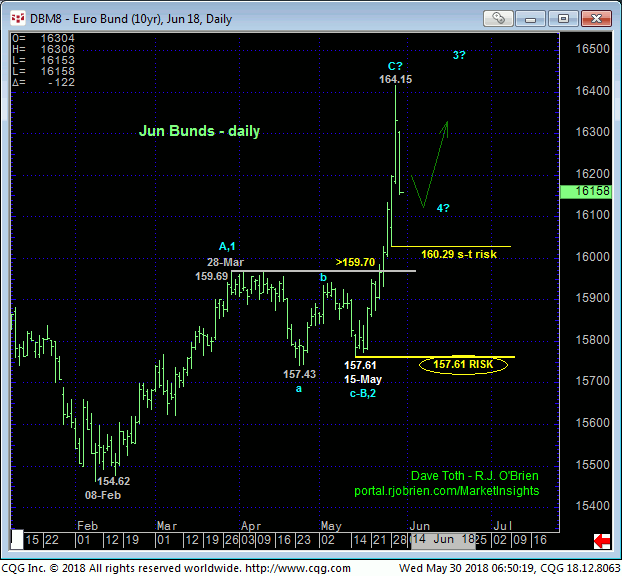
Another gauge or requirement of a resumed long-term bullish count is the market maintaining its upside impulsive integrity. And as a result of the past couple weeks’ impressive rally the market has identified 15-May’s 157.61 low (or 20-Apr’s 157.93 corrective low weekly close) as the latest larger-degree corrective low it must now sustain gains above to maintain a broader bullish count. Its failure to do so will render the past three months’ recovery attempt a 3-wave and thus corrective factor and conversely re-expose the secular bear trend. In this very specific regard, 157.61 serves as our new key long-term risk parameter from which long-term players can objectively base non-bearish decisions like long-covers and new bullish exposure.

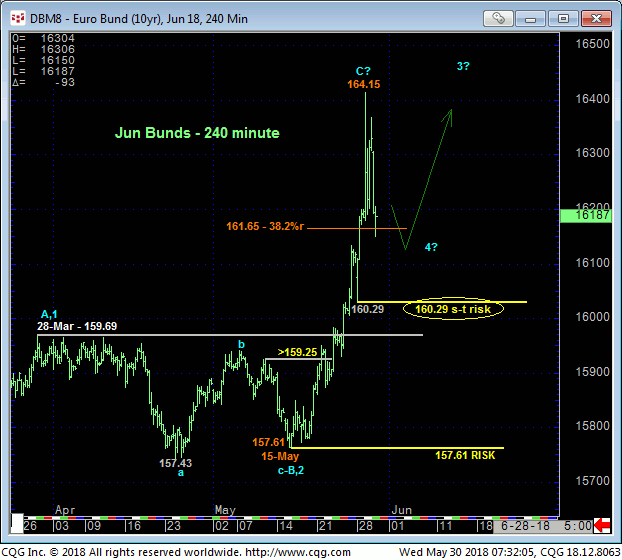
Given the market’s return to the middle of the past 20-month range that included a ton of aimless, choppy whipsaw between Nov’16 and Dec’17, traders should not be surprised by the recurrence of such aimless chop from the 160-to-165-range. The 240-min chart below details the current rally that shows Mon’s 160.29 low as the latest smaller-degree corrective low the market is required to fail below to threaten a more immediate bullish count. Per such this 160.29 level is currently considered our new short-term risk parameter for shorter-term traders with tighter risk profiles.
This chart also shows this market quickly retracing a Fibonacci minimum 38.2% of the 157.61 – 164.15-portion of the developing bull. IF this market is still truly strong “up here” and has a lot more upside remaining per a count calling for a resumption of the secular bull, such shallower setbacks would be expected. If, alternatively, the past quarter’s more extensive recovery is another bear market correction that may be near its end, then we would expect to first see eroding behavior in the weeks ahead below 160.29, then former 159-handle resistance-turned-support and ultimately below 157.61. For the time being however and on the heels of the extent and impulsiveness of the past couple weeks’ rally, all previously recommended bearish policy has been negated. Furthermore, setback attempts to the 162.00-area or below are advised to first be approached as corrective buying opportunities with a failure below 160.29 required to pare or neutralize this exposure. Subsequent weakness below 157.61 will negate this bullish count and re-expose the secular bear trend. In lieu of such weakness further and possibly extended gains should not surprise in the weeks and months ahead.


