As of Thursday afternoon, the August crude oil contract is stronger following a nearly $8.24 decline from the high made on July 3. On July 5, my article noted the potential for the market to reverse following the bearish reaction to a large draw in inventory. Yesterday’s EIA had a build in inventories and while that is fundamentally bearish, prices have recovered after testing lows around $67 the last couple of days.
While the market has held $67.50 recently it has also not held $70 today and the market is weighing a number of factors, such as:
- United States production at 11 million barrels per day at the highest level it has been
- OPEC quota compliance dropping, another sign of more production
- Refinery capacity rates which are still high while easing somewhat this week
- Supply and demand concerns from a number of geopolitical participants
Should $70 continue to act as resistance, it is possible the technical action from today and yesterday is a short squeeze prior to re-testing the $67.50 level.
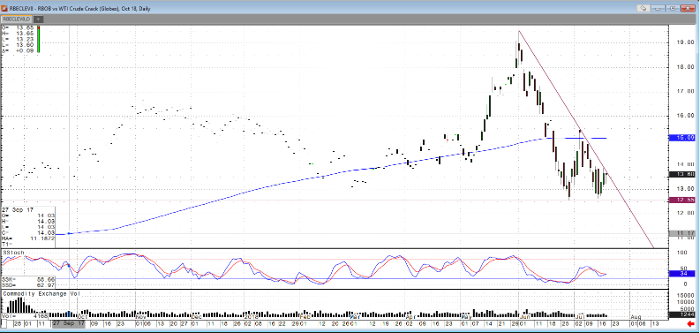
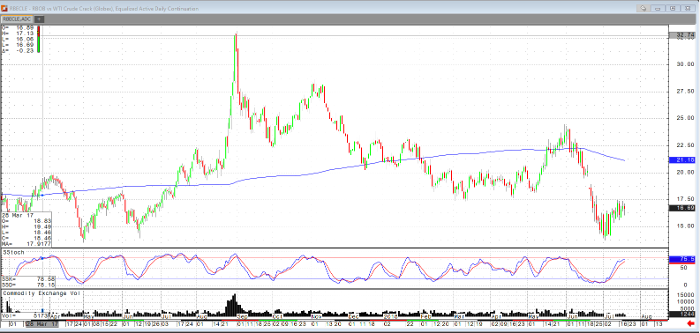
This could be the case considering a number of spread markets covered on our desk, including but not limited to calendar spreads in WTI crude, WTI Brent and the crack spread between WTI crude and RBOB gasoline pictured below.
Looking at the October spread and the continuation chart below, it is clear the relationship has held above recent lows ahead of a potential busy driving and hurricane season.
RBOB vs WTI Crude Oil Crack Oct ’18 Daily Chart

RBOB vs WTI Crude Oil Crack Daily Chart


