Posted on Jan 25, 2024, 07:42 by Dave Toth
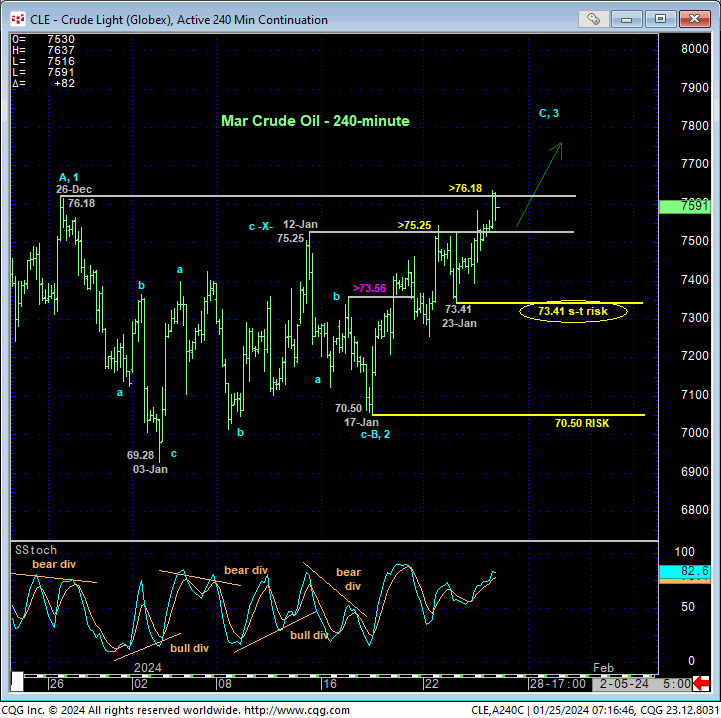
We’ve been discussing the importance of 26-Dec’s 76.18 high as a key directional flexion point since 28-Dec’s bearish divergence in momentum defined it as one. The 240-min chart below shows overnight’s break above this level that, as we’ll discuss below, confirms a bullish divergence in WEEKLY momentum that, in fact, breaks Sep-Dec’s major, if intra-year-range downtrend from 95.03 to 67.71.
The important by-products of today’s reaffirmation of the past week’s uptrend and developing strength are the market’s definition of smaller- and larger-degree corrective lows at 73.41 and 70.50 that it now needs to sustain trendy, impulsive gains above to maintain our broader base/correction/reversal count. Per such, these levels serve as our new short- and long-term parameters from which the risk of a non-bearish decisions like short-covers and bullish punts can be objectively rebased and managed by short- and longer-term traders, respectively.
On a broader scale, our base/correction/recovery count remains predicated on:
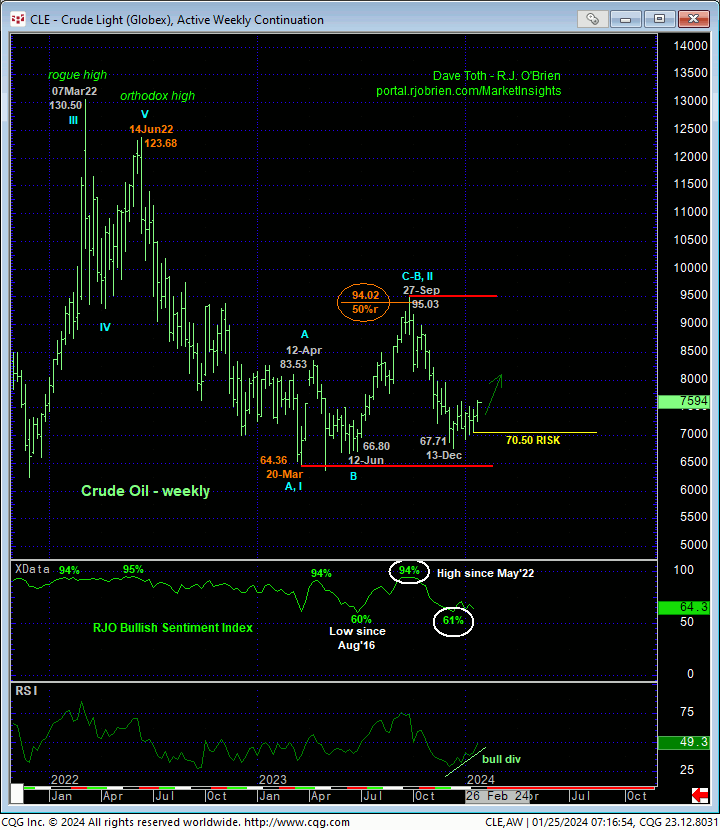
- a now-confirmed bullish divergence in WEEKLY momentum stemming from
- the extreme lower recesses of the past YEAR’S range
- amidst historically low levels in our RJO Bullish Sentiment Index and
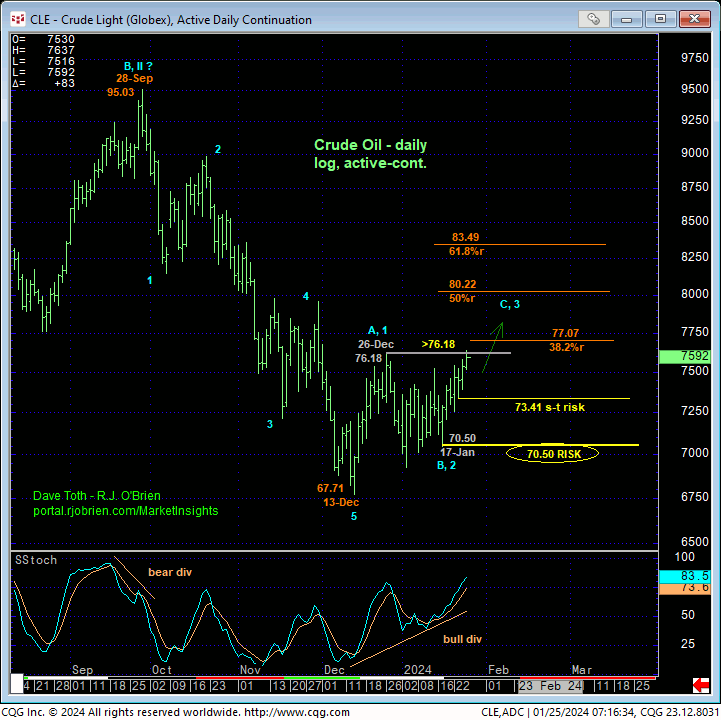
- a textbook complete 5-wave Elliott sequence down from 28-Sep’s 95.03 high to 13-Dec’s 67.71 low as labeled above.
This is a unique and compelling list of technical facts that warns of at least a larger-degree correction or Sep-Dec’s entire decline and possibly a return to the upper recesses of the past year’s range. By breaking 26-Dec’s 76.18 high and confirming a bullish divergence in weekly momentum, the new longer-term trend has been exposed as UP, giving the bull every opportunity to PERFORM. This required performance will be gauged by trendy, impulsive and increasingly obvious behavior to the upside. A setback below our short-term bull risk parameter at 73.41 will be the first indication that this count is wrong while commensurately larger-degree weakness below 70.50 will negate it, chalk up the recovery from 67.71 as a 3-wave correction and re-expose Sep-Dec’s downtrend.
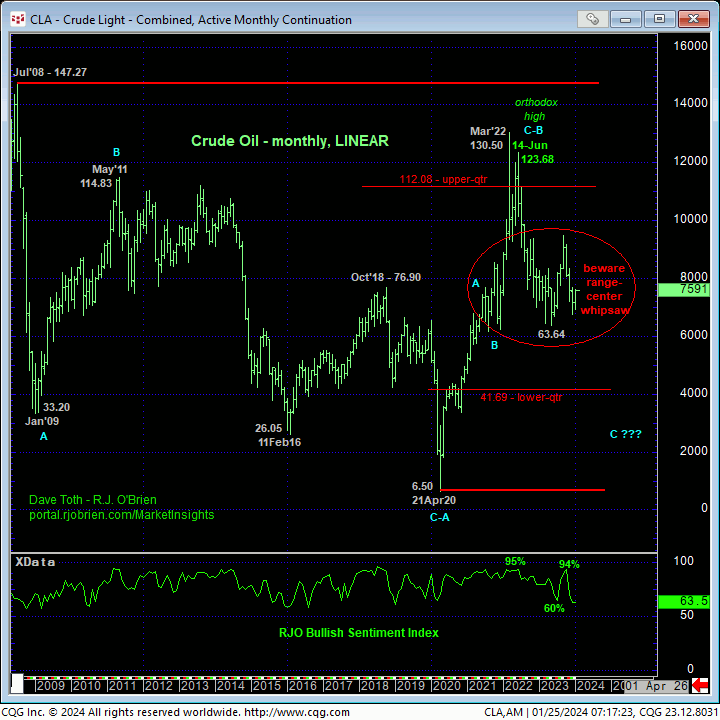
Looking for prospective flies in the bullish ointment, traders are reminded of the market’s position still within the middle-half bowels of the past YEAR’S lateral range that remains a subset of this market’s massive but lateral historical range shown in the monthly chart below. We raise this issue again to remind traders of the greater odds of aimless whipsaw risk typical of such range-center environs that takes us back to our “requirement” of trendy, impulsive and increasing obvious behavior to the upside to reinforce our bullish count and the importance of recent corrective lows and bull risk parameters like 73.41 and especially 70.50.
These issues considered, a bullish policy and exposure are advised for both short- and long-term traders with a failure below 73.41 required for shorter-term traders to move to the sidelines and commensurately larger-degree weakness below 70.50 for longer-term players to follow suit. In lieu of such weakness, further and possibly protracted gains straight away are anticipated.