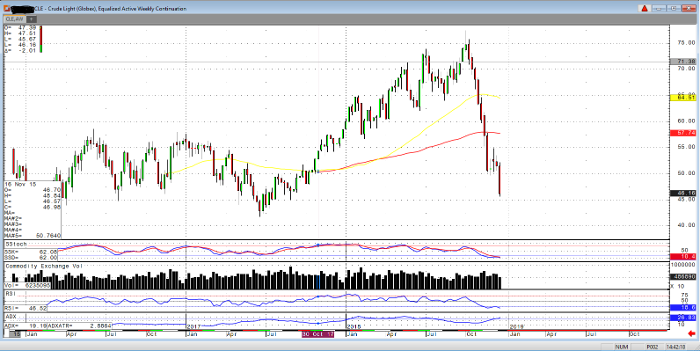
As of Thursday afternoon, the February crude oil contract was trading around $46 per barrel, down over $2 per barrel on the day and continuing the slide which began at the beginning of October. While there are a number of fundamental factors listed below, the equalized weekly active continuation chart shows the severity of the damage done the last 10 weeks.
In addition to the record supply from countries such as the United States and Russia, and the implications for OPEC compared to their production and that of Saudi Arabia; there are also factors such as global demand with a number of equity indices trading at their lows for the year and 2019 and 2020 forecasts for decreased growth and GDP.
While the market has been bearish and may remain so given any major developments, bulls may note oversold levels on some indicators and the possibility for the markets to balance, as the multiweek slide in crude pictured below is clearly more pronounced than a number of weeks past.
Also of note are the technical levels of the past and the market’s price action before, during and after such levels. For instance, the last 10 weeks sell off takes the market to levels it has not been since the run up from June 2017, and prior to that the market spent a good amount of time with less pronounced ranges (on a weekly basis compared to those seen lately).
Crude Light Weekly Chart


