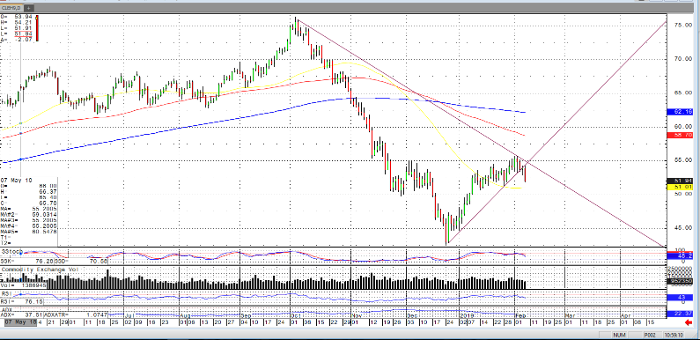
As of Thursday morning, the February crude oil market is trading on its lows amid several factors, leading decidedly risk off trading. Strength in the dollar index, coinciding with weakness in the euro, Australian dollar, Canadian dollar, and other commodity currencies has led to crude probing lower in the trendline seen in the daily chart below. Other contributing factors include strength in notes and a sell-off in equities and energies.
In addition to the demand side of the equation and outside markets, supply is also a factor as yesterday’s EIA report showed a build in inventories. This increase represents a build above the level a year ago, along with production in the United States near 12 million barrels per day and almost a fifth more than the same time last year.
Moving forward, the $52.50 per barrel level may be of interest as can be seen in the chart below. A good amount of highs and consolidation may be seen at that level in recent weeks. Also, this would be the midpoint of a $50-$55 range mentioned by many. Given that there are a number of options on the crude market at the $52.50, $55 and $50 price level in addition to others, a number of options strategies may be considered as well as combination of futures and options on futures.
If you would like to learn more about energy futures, please check out our free Fundamentals of Energy Futures Guide
Crude Oil Mar ’19 Daily Chart


