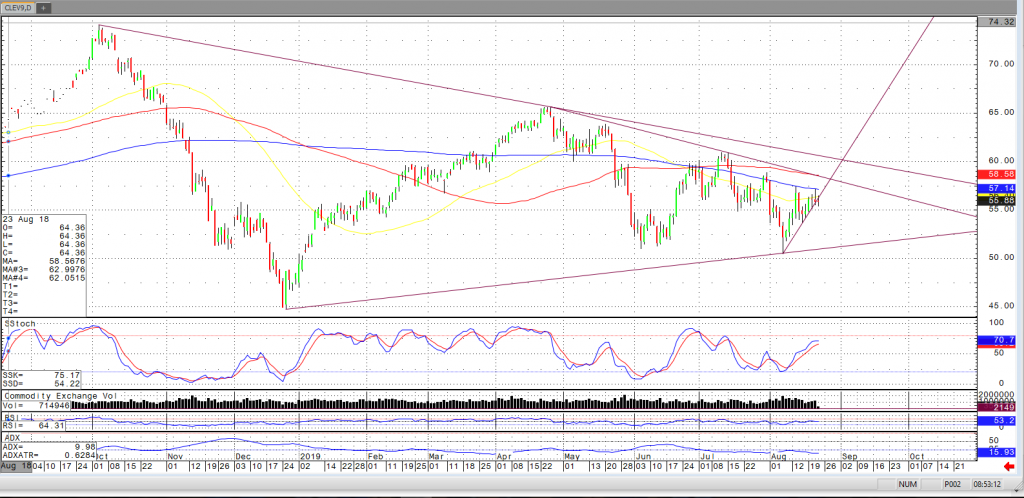
Thursday morning’s trading has the October 2019 Crude oil contract trading near $56.18, up $0.50 on the day as the market continues its strength since the August 7th low. The market is also approaching the 50, 100, and 200-day moving averages and traders may note if these act as resistance or support in the near future.
The market has weighed several factors, including:
- continued saber rattling from Iran
- record production from the U.S.
- draws from inventory featured in yesterday’s E.I.A. report
- global economic health – outside markets
Moving forward, the market should continue to weigh these factors in addition to further developments. Should the market trade past the averages pictured in the chart below, there is the possibility that the market trades toward the upper end of its range, especially considering a potential double bottom the June and August lows. Should the market remain below the averages, it is not difficult to imagine the market re-testing the some of the years lows.