Posted on Jan 23, 2024, 09:03 by Dave Toth
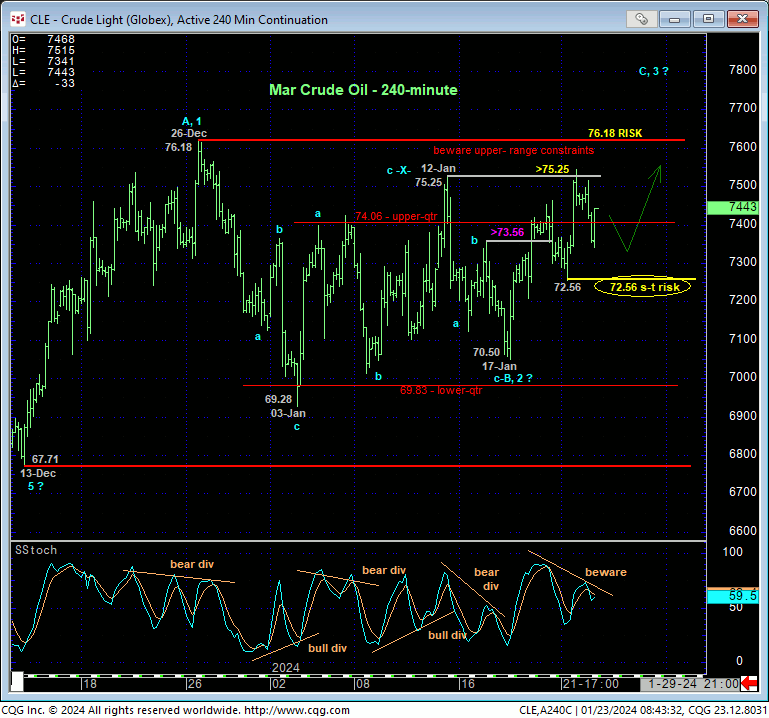
In yesterday’s Technical Webcast we discussed the increased likelihood of an eventual breakout above 26-Dec’s pivotal 76.18 high if the market could take out 12-Jan’s 75.25 high. The 240-min chart below shows yesterday’s break above 75.25 before slumping over $2.00 in yet another rejection and acknowledgement of the resistant constraints of the upper-quarter of the past month’s lateral, choppy range. Despite this relapse however, yesterday’s break above Fri’s 74.63 high AND 12-Jan’s 75.25 high leaves yesterday’s 72.56 low in its wake as the latest smaller-degree corrective low this market is now required to fail below to break the past week’s developing uptrend and expose another intra-range relapse and the perpetuation of this incessant range. Until/unless such sub-72.56 weakness is confirmed however, further gains are expected with 26-Dec’s key 76.18 the remaining hurdle to a more upwardly-skewed correction or reversal of Sep-Dec’s entire 95.03 – 67.71 decline. Per such, we’re identifying 72.56 as our new short-term but key parameter from which a cautious bullish stance can be objectively based and managed and 26-Dec’s 76.18 high as the obvious threshold this market needs to break to break Sep-Dec’s downtrend and expose a more vertical correction or reversal higher. Traders are urged to toggle directional biases and exposure around these two levels commensurate with their personal risk profiles.


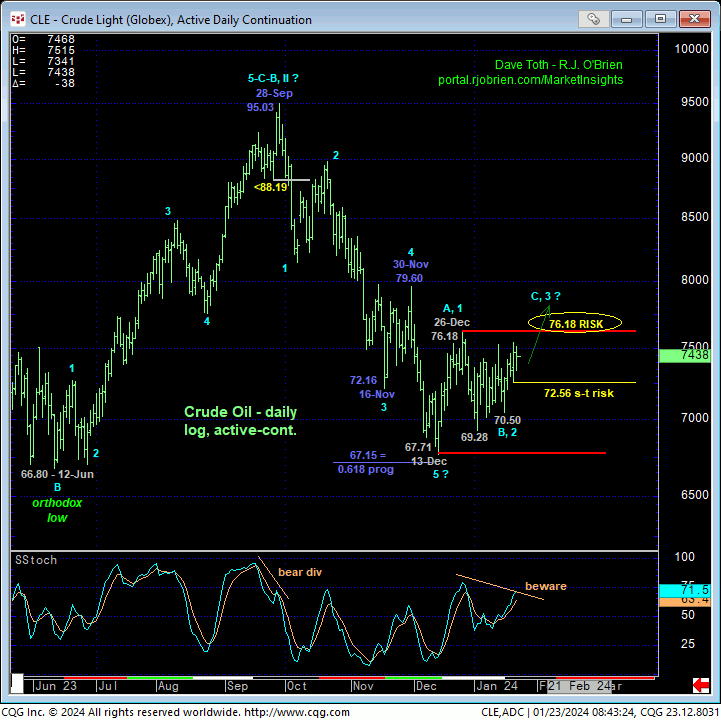
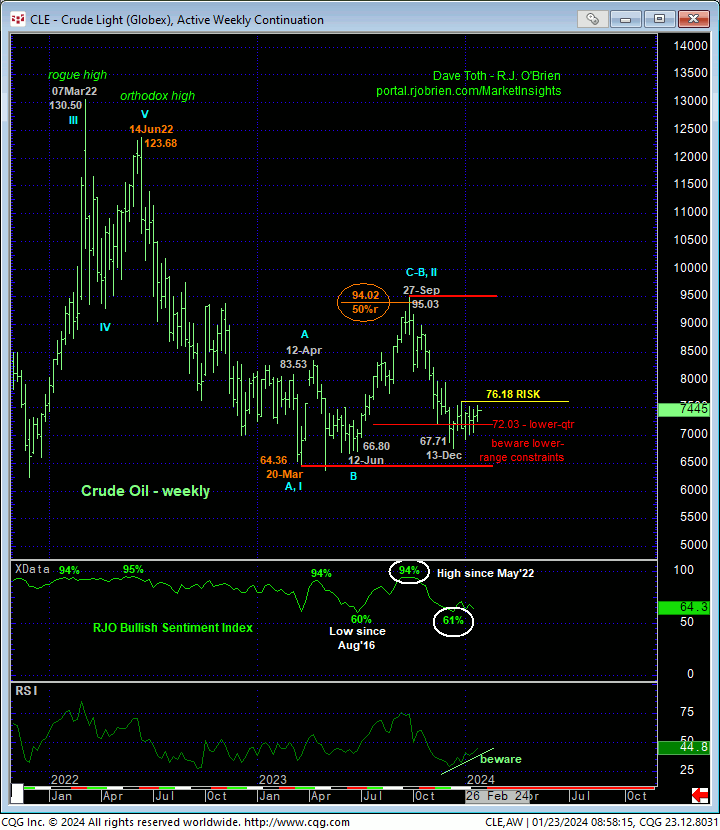
The significance of 26-Dec’s 76.18 as a key toggle point stems from the unique and compelling list of technical elements that warns of a more upwardly-skewed correction or reversal higher:
- the market’s rejection thus far of the lower-quarter of the past year’s range amidst
- a return to historically bearish levels in our RJO Bullish Sentiment Index
- the nicely developing potential for a bullish divergence in WEEKLY momentum (confirmed above 78.16)
- the prospect that Sep-Dec’s decline is a textbook complete 5-wave Elliott sequence as labeled in the daily log chart above.
Proof of larger-degree WEEKLY strength above 78.16 will, in fact, define 13-Dec’s 67.71 low as THE END of Sep-Dec’s decline and confirm a larger-degree correction or reversal of this decline of indeterminable scope.
These issues considered, a cautious bullish stance is advised for shorter-term traders with a failure below 72.56 negating this specific call and warranting its cover. A cautious bearish stance remains OK for longer-term commercial players with a recovery above 76.,18 warranting the immediate cover of any remaining bearish exposure and reversal into a new bullish stance with subsequent weakness below 72.56 required to negate that new bullish policy.


