Posted on Oct 05, 2023, 09:07 by Dave Toth
The extent and impulsiveness of the past couple days’ plunge confirms our peak/correction/reversal count introduced in Mon’s Technical Webcast and exposes potentially protracted losses in the weeks and even months or quarters ahead. Because of the magnitude of Jun-Sep’s uptrend that still requires a commensurately larger-degree momentum failure below 24-Aug’s 77.59 low to break, we cannot ignore the prospect that the past week’s relative meltdown is just part of a slightly larger-degree correction within something broader to the bull side. HOWEVER, for some longer-erm elements discussed below, it would also be unwise to ignore the developing potential for a longer-term bearish count that could result in a resumption of Jun’22 – Mar’23’s major downtrend to eventual new lows below $64 until and unless this market recoups last week’s 95.03 high.
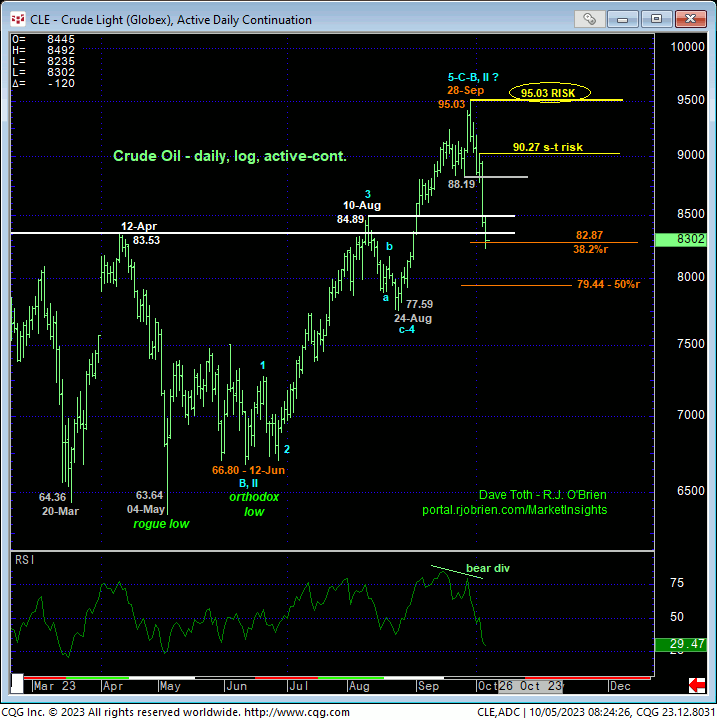
Yesterday’s decisive break below 26-Sep’s 88.19 corrective low confirms a bearish divergence in daily momentum. This mo failure defines 28-Sep’s 95.03 high as the END of at least the portion of this year’s recovery from 24-Aug’s 77.59 low and very possibly the end of a major 5-wave Elliott sequence up from 12-Jun’s 66.80 low. The daily log chart below also shows this market’s quick 38.2% retrace (to 82.87) of this entire 3-1/2-month splurge and also to a key area of former resistance-turned-support around the 84.89-to-83.53-area that capped this market for most of this year. IF IF IF the past week’s relapse is “just” another correction within the broader bullish trek to $100 that many have been forecasting of late, then we would expect this general 83-handle-area to hold. Further trendy, impulsive behavior below this area will not only reduce the odds of any continued bullish count, but also raise the odds of a peak/reversal count that could have currently unfathomable downside implications to multi-year lows below $63.

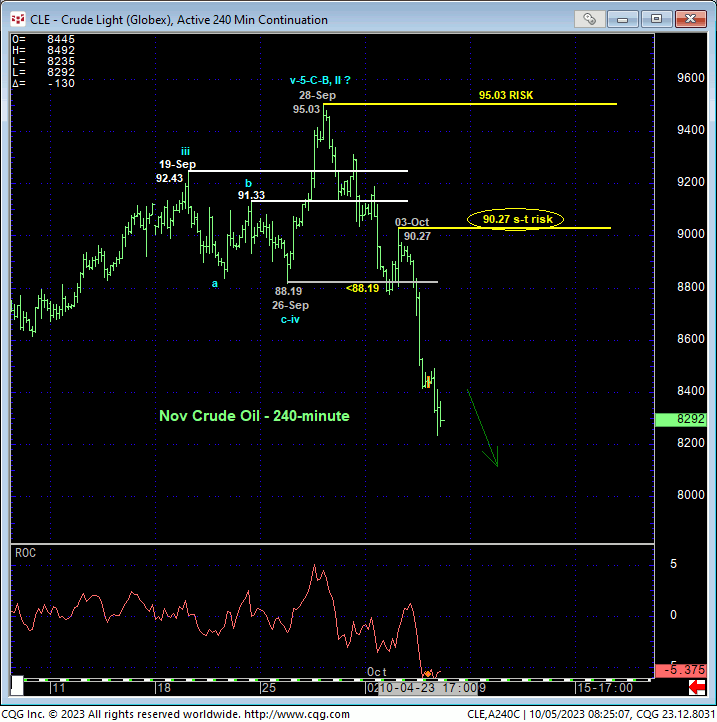
On a short-term basis, the 240-min chart below shows the past week’s demise defining 28-Sep’s 95.03 high as one of obvious importance and Tue’s 90.27 high as the latest smaller-degree corrective high. A recovery above 90.27 is required to jeopardize the impulsive integrity of this developing decline, render it a 3-wave and thus corrective affair and re-expose the broader bull. Until and unless such strength is proven, we anticipate a continuation of this impulsive decline into an eventual 5-wave sequence that could still many dollars from completion. Per such, 90.27 and 95.03 serve as our new short- and long-term parameters from which the risk of a new bearish policy and exposure can be objectively rebased and managed

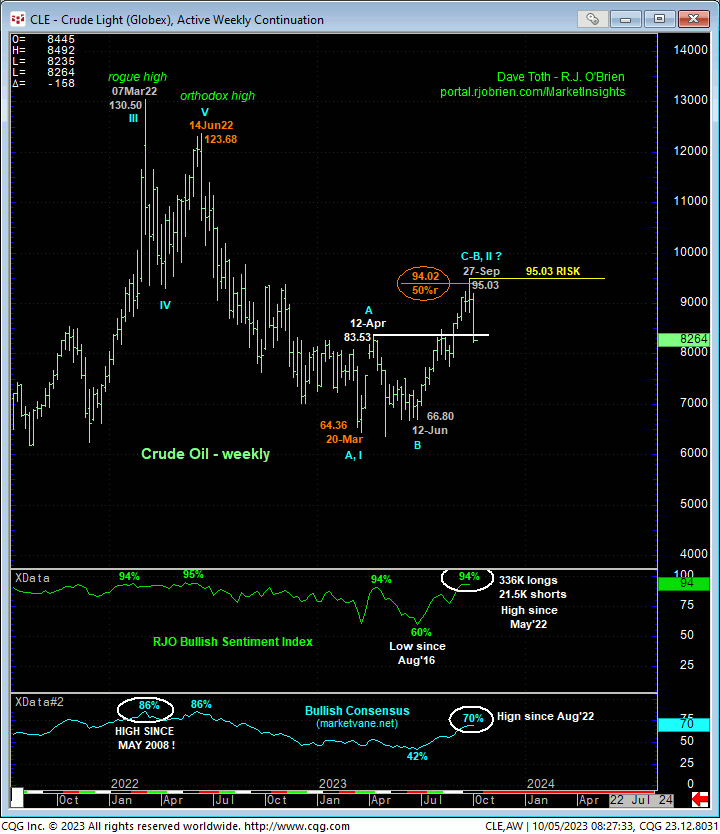
On a long-term scale sown in the weekly chart below, elements contributing mightily to a major peak/reversal count include:
- this week’s significant threat to Jun-Sep’s uptrend amidst
- historically frothy bullish sentiment/contrary opinion level from
- the immediate area around the (94.02) 50% retrace of Jun’22 – Mar’23’s decline from 123.68 to 64.36
- what thus far is only a 3-wave (and thus potentially corrective) recovery from Mar’s 64.36 low that followed
- an extensive and impulsive decline from Jun’22 to Mar’23 that is arguably just the INITISAL (A- or 1st-Wave) of a new secular bear market.
Indeed, the current 94% reading in our RJO Bullish Sentiment Index reflecting a whopping 336K Manage Money long positions reportable to the CFTC versus only 21K shorts is considerable fuel for downside vulnerability as the overall market forces the capitulation of this long-&-wrong bullish exposure. Perhaps the past couple days’ collapse is the start of this capitulation. But there would be plenty more to go.
Looking many months or quarters ahead, if Mar-Sep’s 3-wave 50% recovery did complete a mere correction of Jun’22 – Mar’23’s initial counter-trend decline, a (C- or 3rd-Wave) resumption of a multi-quarter peak/reversal process to eventual new lows below 64.36 would be expected. To negate this long-term bearish count, al the bull needs to do is take out last week’s 95.03 high. Until and unless such strength is proven, any/all bearish counts are in play, including a resumption of the major bear to new lows below 64.36.

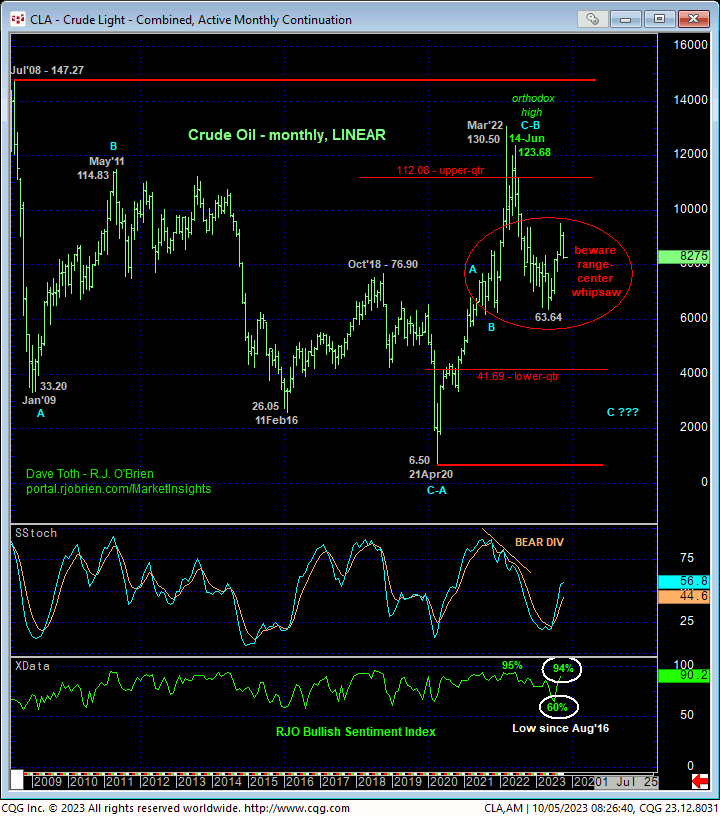
Lastly, what’s not lost on us is this market’s position still deep, dep, deep within the middle-half bowels of its massive but lateral historical range shown in the monthly chart below. Such range-center environs are always approached as fertile ground for aimless whipsaw risk warranting a more conservative approach to directional risk assumption. And indeed, this long-term perspective puts the past 12 MONTHS’ choppin’ around into context. Against this backdrop, and even if our resumed long-term bearish count is correct, does this mean the market’s gonna make it easy on us trend-followers with an easy, sustained, impulsive move lower? Maybe, maybe not. Herein lies the importance of identifying corrective highs and risk parameters commensurate with one’s personal risk profile like the 90.27 and 95.03 levels specified above.
These issues considered, a bearish policy and exposure are advised with a recovery above at least 90.27 required to threaten this call. We will be watchful for smaller-degree corrective pops and the continuation of this slide in the days ahead to identify new and tighter short-term bear risk parameters and update traders in this blog accordingly.


