The crude oil market this week shifted from weighing and focusing on demand concerns (related to global trade and growth) and supply concerns (related to tensions on the Middle East) to decidedly bearish on concerns for demand.
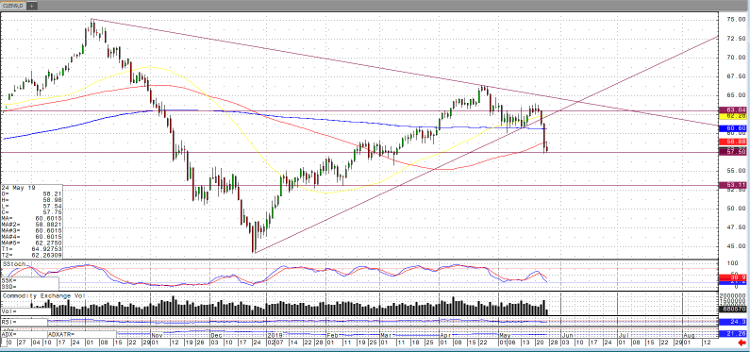
While the market looked to be in a range between $60 and $65 for the most part since early April, it seemed the market was facing a trend decision or breakout by early June, pictured in the chart below. Also, in the chart below, the 200-day moving average and 100-day moving average were breached in this week’s trading.
Clearly, the market and chart below reflect the breakdown in trade talks and the potential for a trade deal between the United States and China as well as the build in inventories in the weekly EIA report which showed a build in crude of 4.7 million barrels as well as builds in gasoline and distillates.
Moving forward, as of yesterday and so far, today, the market has held the $57.50 level for the most part and coincides with late February and early March congestion followed by a run up and the mid November 2018 levels preceding the following sell off.
Crude Oil Jul ’19 Daily Chart


