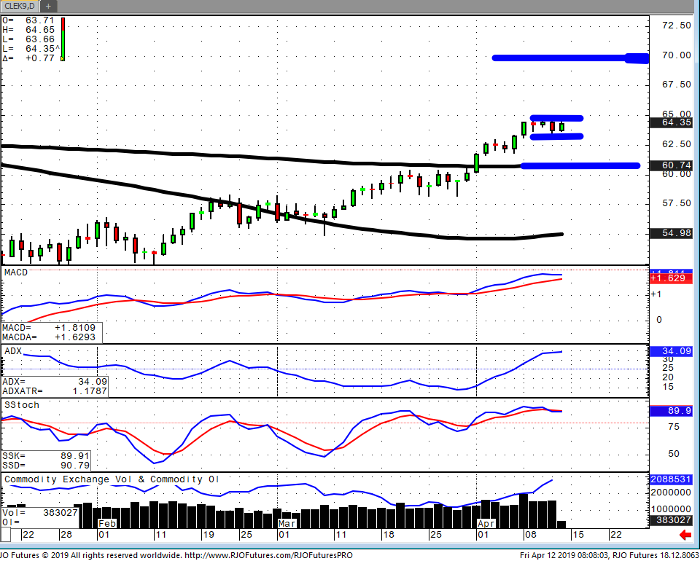
On a year to date performance, the energy sector continues to dominate four of the top five spots with gasoline up 56%, WTI up 42%, Brent up 33% and Heating oil up 24%. The main fundamental highlights have been increasing demand as we approach the summer driving season while OPEC has maintained its cuts. Although U.S. oil production has continued to outperform pressing through 12 million barrels per day this has barely impacted the price of crude oil. So, the key levels you want to watch are $65 on the upside where an extension to $70 could be possible. Where yesterday’s low (April 11th) at $63.31 should act as critical support and any violation of this number on a closing basis could led to a washout down to the 200 DMA at $60.74.
Crude Oil May ’19 Daily Chart


