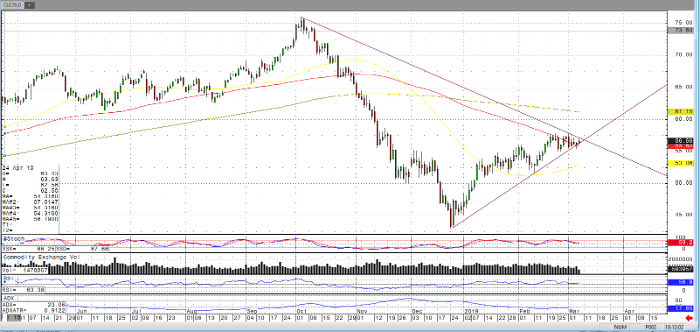
As of Thursday morning, the April crude oil contract continues to oscillate around the 100-day moving average, as I mentioned in my previous post 2 weeks ago. Traders factoring in yesterday’s increase in inventories from the EIA number, which showed a 7.1 million barrel increase, as well as equity indices which have been pausing if not possibly toppy or turning should find interest in the market’s proximity to the trendlines pictured in the chart below.
The falls from October’s high and the rise from December’s low are coinciding with the recent weeks’ consolidation to form a possible breakout. While there is no shortage of fundamental chatter whether it be from heads of state, OPEC, the middle east, Venezuala, refining, exports, etc., this technical formation should lead consideration in my opinion. As noted previously, the $55 level, trendlines pictured below, and averages should be monitored and could be used when considering a trading strategy.
Oil Apr ’19 Daily Chart

If you would like to learn more about energy futures, please check out our free Fundamental of Energy Futures Guide.


