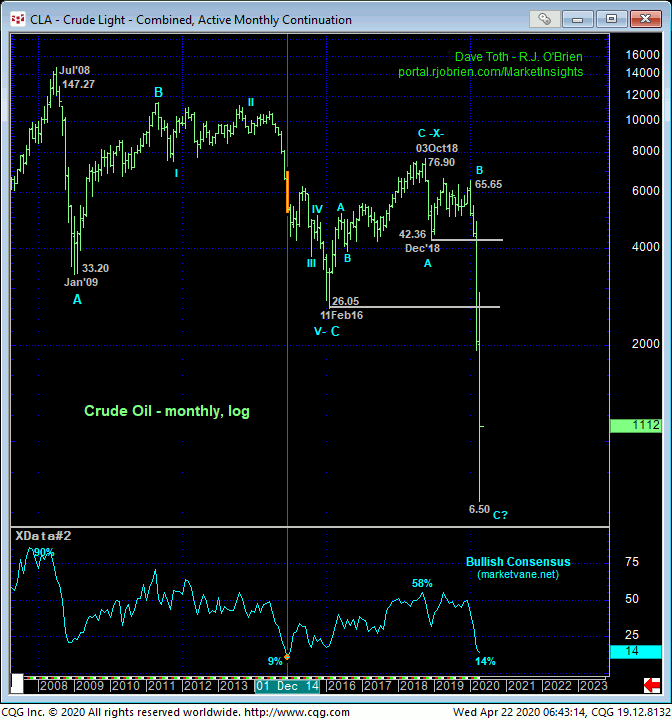
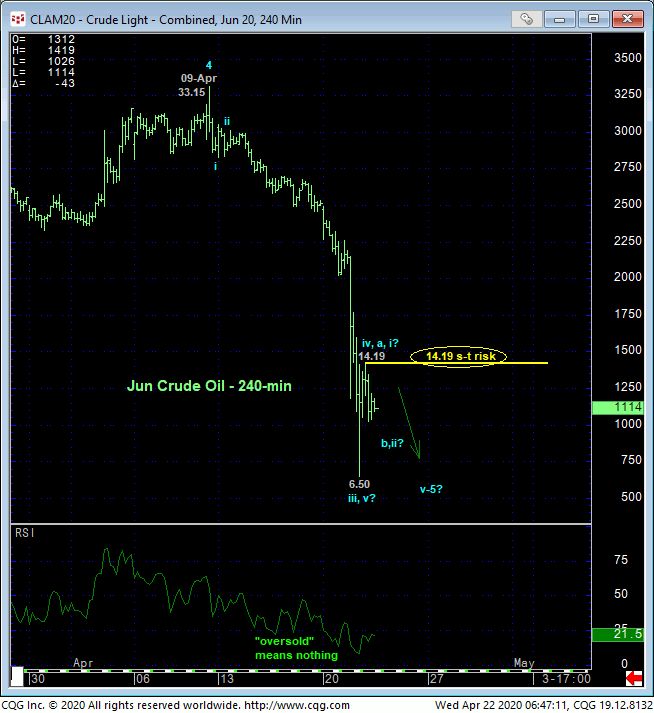
Understanding that MOMENTUM is the technical tool used to navigate prospective trend changes, this is where our focus remains relative to the gargantuan and arguably still-intact downtrend from early-Jan’s high. We define a bullish (in this case) divergence in momentum by a recovery above a prior corrective high or an initial counter-trend high. Such a requirement is crucial in considering non-bearish decisions like short-covers and new bullish punts as satisfying either requirement leaves specific, market-defined lows in its wake that then become the new risk parameters from which those non-bearish decisions can only then be considered objective. Without these conditions being met, subjective and inept references to a marketing simply being called “oversold” provides no such objective risk parameter and is thus outside the bounds of technical discipline.
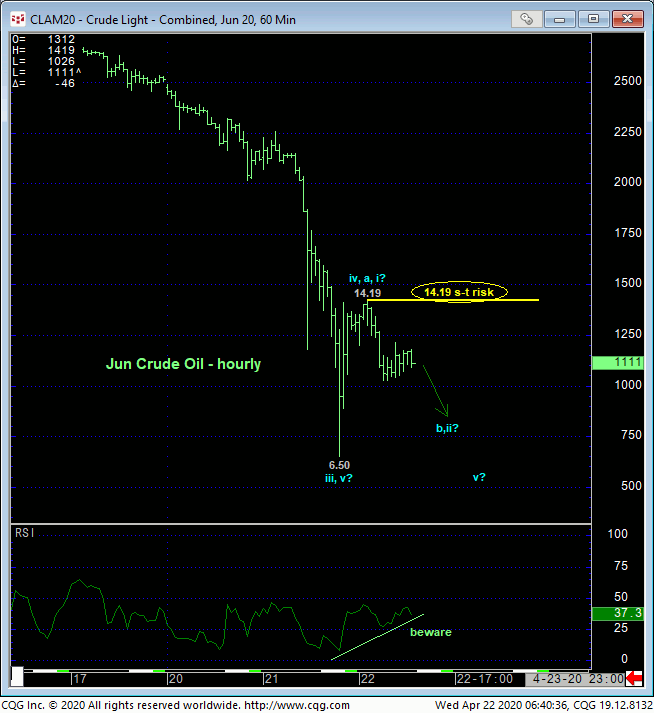
The 240-min chart above shows the past couple weeks’ meltdown where discerning either a smaller-degree corrective high or an initial counter-trend high to designate as a tighter but objective risk parameter is difficult to see. Drilling down to an hourly chart below however shows yesterday’s recovery attempt defining a 14.19 high of developing importance. A recovery above 14.19 would render it an initial counter-trend high and confirm a bullish divergence in very short-term momentum. Per such, we’re identifying this 14.19 level as our new short-term risk parameter to a still-advised bearish policy. Now, given the magnitude of the secular bear market that’s been like no other, we cannot conclude a larger-degree reversal from a smaller-degree momentum failure like a recovery above 14.19. Indeed, such 14.19+ strength could easily be just another interim (4th-Wave) corrective hiccup before another (5th-Wave-down) round of blood-letting. But at least such 14.19+ strength would leave market defined lows in its wake from which the risk of any non-bearish decisions could only then be objectively based and managed. Until such 14.19+ strength is proven, a resumption of the secular bear should not come as a surprise.
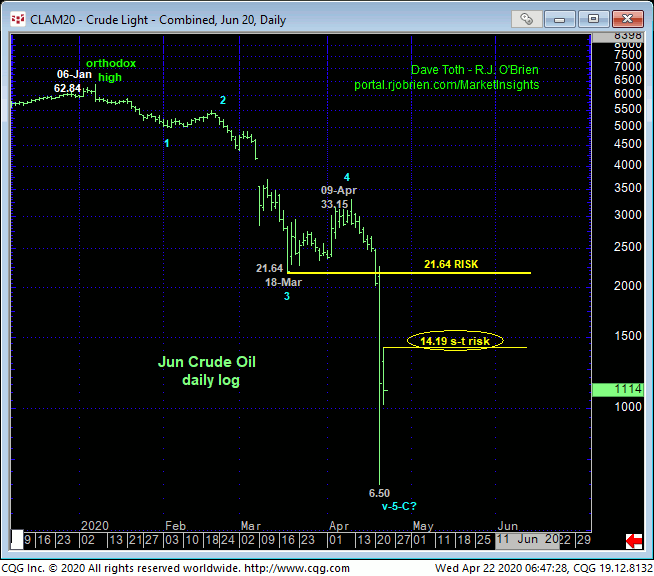
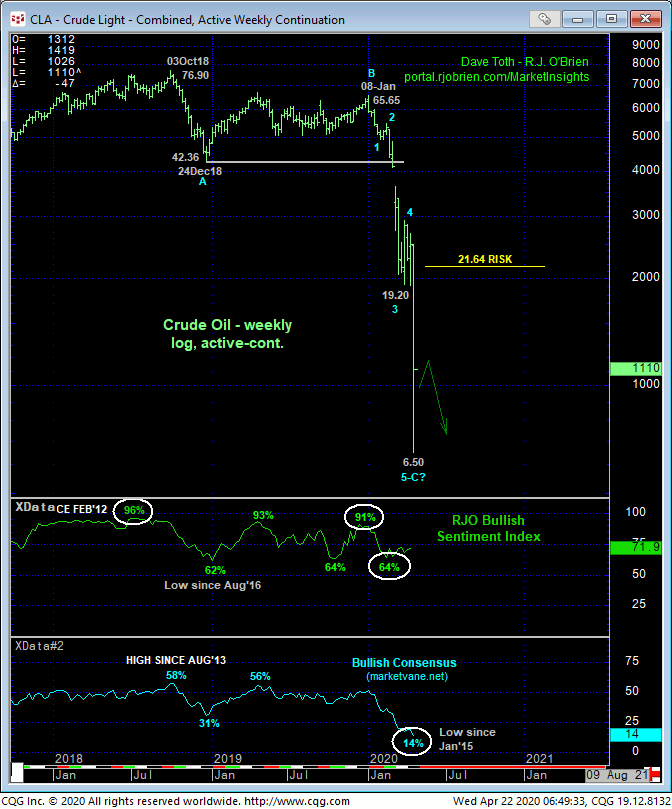
The daily (above) and weekly (below) log scale charts chow the magnitude of this secular meltdown. Futures data goes back to 1983, and these are new lows for the entirety of this contract. The base/reversal process could be massive in terms of both price AND TIME. Recoveries shy of 18-Mar’s 21.64 (suspected 3rd-Wave) low easily fall within the bounds of a correction. And even after an extensive, impulsive 5-wave rally to anywhere around the 20.00-area, a subsequent and potentially extensive 2nd-wave corrective relapse is likely. On this broader scale, the market has shown NO evidence of a bottom yet.
Again, trends typically slow down with corrective hiccups and resumed losses that are not sustained before evidence of a prospective bottom appears and any non-bearish decisions can be considered objective. Perhaps yesterday’s pop to 14.19 is part of this slowdown process. But clearly, further evidence is necessary before we can objectively start talking about a bottom.
