Posted on Oct 20, 2022, 08:40 by Dave Toth
DEC RBOB
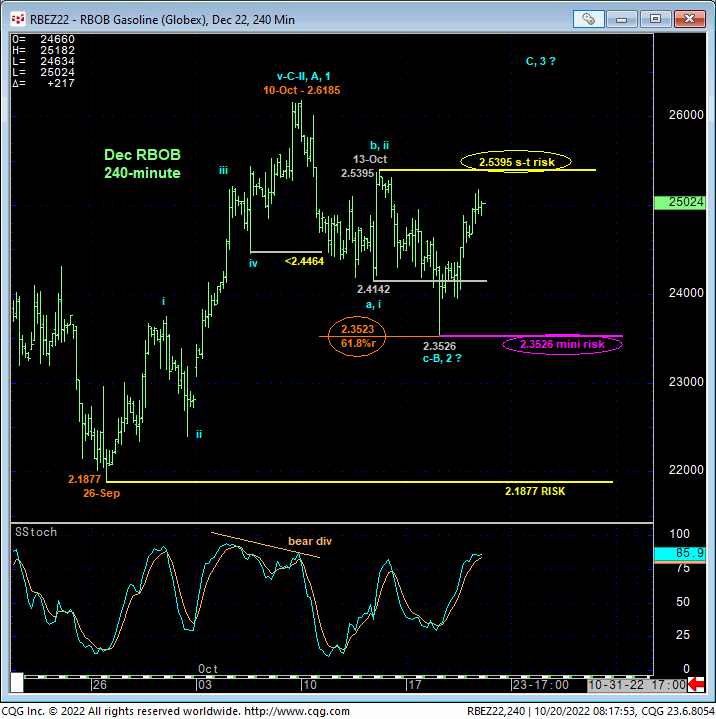
While the market has yet to recoup 13-Oct’s 2.5395 high and short-term bear risk parameter in the now-prompt Dec contract needed to confirm the past couple weeks’ sell-off attempt as a 3-wave and thus corrective affair, the Fibonacci fact that the past couple days’ recovery stems from the exact (2.3523) 61.8% retrace of late-Sep/early-Oct’s 2.1877 – 2.6185 initial counter-trend recovery warns of exactly such a bullish count. It is clear that the sell-off attempt from 2.6185 to Tue’s 2.3526 low is only a 3-wave event thus far. Left unaltered by a relapse below 2.3526, this 3-wave dip may be considered the B- or 2nd-Wave correction of late-Sep/early-Oct’s 2.1877 – 2.6185 A- or 1st-Wave ahead of a resumption of that uptrend that preceded it to new highs above 2.6185. In this regard, Tue’s 2.3526 low serves as a mini risk parameter from which non-bearish decisions like short-covers and bullish punts can now be objectively based and managed.

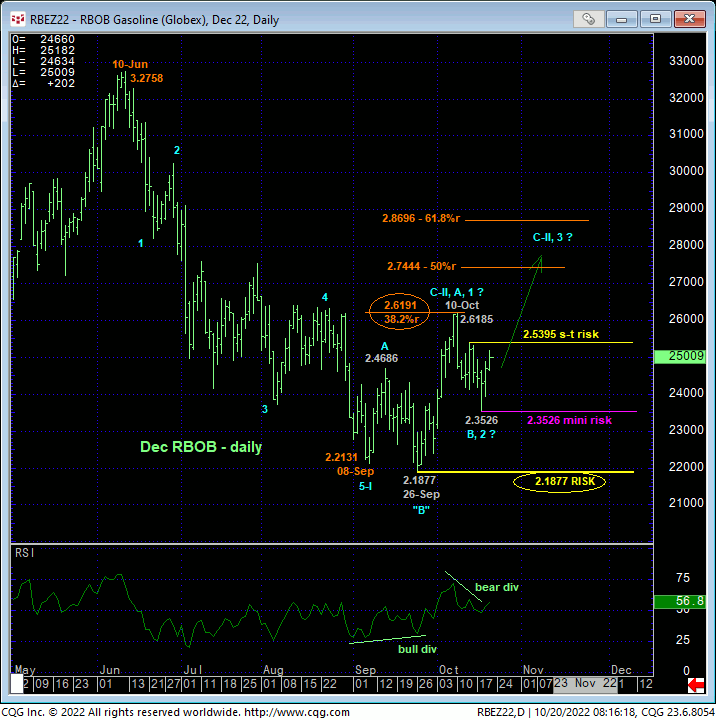
From a longer-term perspective and on the heels of Tue’s bearish divergence in momentum from the 38.2% retrace of Jun-Sep’s 3.2758 – 2.2131 decline, further strength above 2.5395 remains required to mitigate an alternate bearish count and resurrect a count calling for a larger-degree (2nd-Wave) correction of Jun-Sep’s entire decline that could produce protracted gains above 10-Oct’s 2.6185 high. Which side of the recent smaller-degree flexion points and key short-term risk parameters at 2.5395 and 2.3526 this market flops over first will likely reinforce a broader move in that direction.
These issues considered, both short- and longer-term traders are advised to toggle directional biases and exposure around this 2.3526 – 2.5395-range, with a recovery above 2.5395 reinforcing odds of a resumption of late-Sep/early-Oct’s uptrend to levels potentially well above 2.6185.

DEC CRUDE OIL

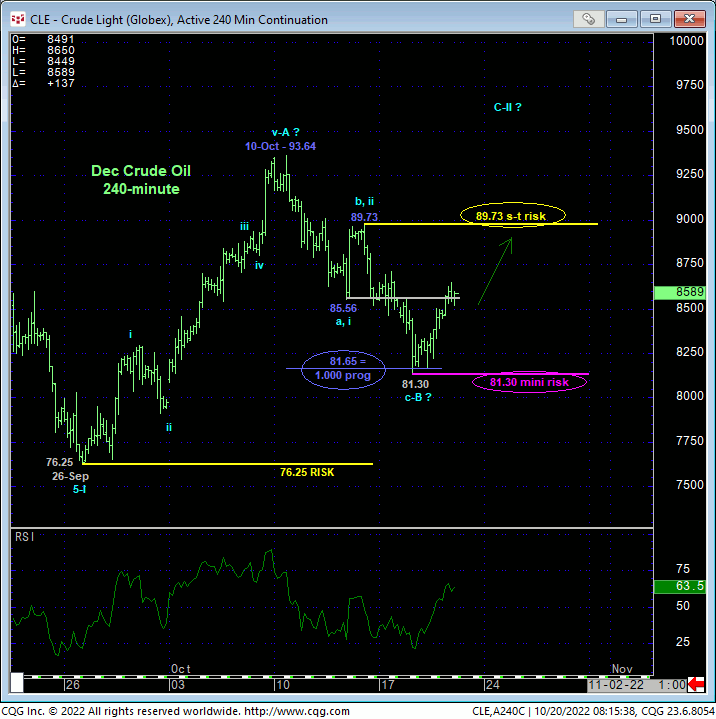
Similar to the technical construct discussed above in RBOB, the 240-min chart of the now-prompt Dec crude oil contract above shows the past couple days’ recovery that warns that the past week’s setback is just a 3-wave and thus (B-Wave) correction within a larger-degree correction of Jun-Sep’s broader downtrend. Tue’s 81.30 low was just 0.35-cents away from the (81.65) 1.000 progression of last week’s initial 93.64 – 85.56 decline taken from last Fri’s 89.73 high. While a recovery above 89.73 remains required to confirm this recent setback as a 3-wave and thus corrective affair, we believe the extent of the past couple days’ recovery raises the odds of such a bullish count that warns of a resumption of late-Sep/early-Oct’s initial A-Wave uptrend that preceded it to new highs above 93.64.
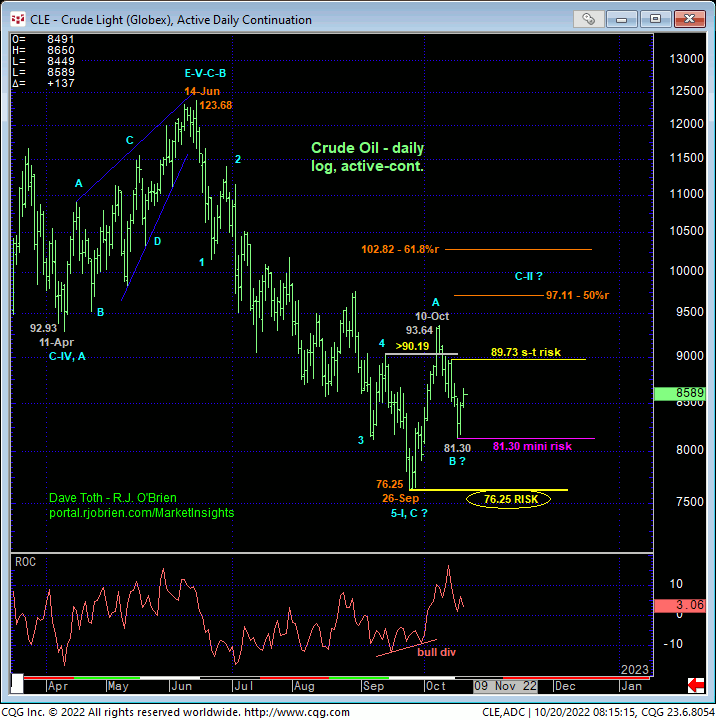
In effect, we believe this market has identified 81.30 and 89.73 as the key directional flexion points and traders are advised to toggle directional biases and exposure around these levels. A recovery above 89.73 would be expected to expose potentially sharp gains to new highs above 93.64 as part of a larger-degree (2nd-Wave) correction of Jun-Sep’s downtrend within a massive PEAK/reversal process.


