Crude oil futures have completed the latest double bottom pattern and is now creating a rising wedge pattern leaving $60.28 as a breakout point on the chart. With OPEC extending cuts for another 9 months, this leaves the market open to a contraction in current supply versus the five-year average if the driving season picks up. The red flag is a close below $57.20 where we could see a quick break back down to $55.00. This could happen on the lighter volume into the holiday market and slumping economic data leaving the market more of a coin flip at this point. Continue to watch the technicals and enjoy your holiday.

Crude Oil August ’19 Daily Chart
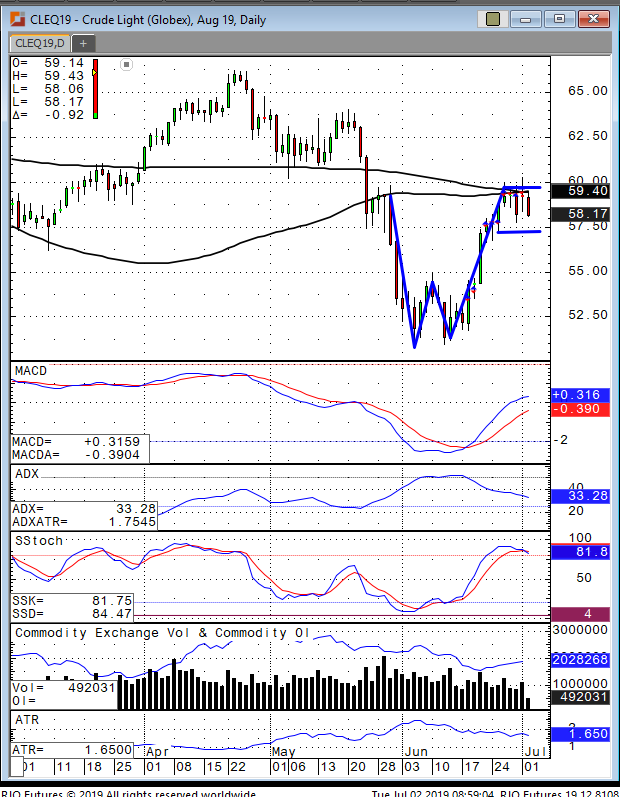
Crude Oil Aug '19 Daily Chart

Phillip Streible

Early in his career Phillip began trading his own account as a screen trader focusing on the metals, grains and stock indices. He then became a Series 7 licensed financial consultant with A.G. Edwards. Later, he expanded his trading experience into a Series 3 licensed commodity broker with Investment Analysis Group. Most recently he was a senior market strategist at MF Global before joining RJO Futures in October 2011 as a senior commodities broker. As a senior commodities broker his goal is to show clients how to anticipate, recognize and react to bull and bear market conditions through the use of technical analysis techniques that help them to define risk.